Bryan Taylor, Chief Economist, Global Financial Data
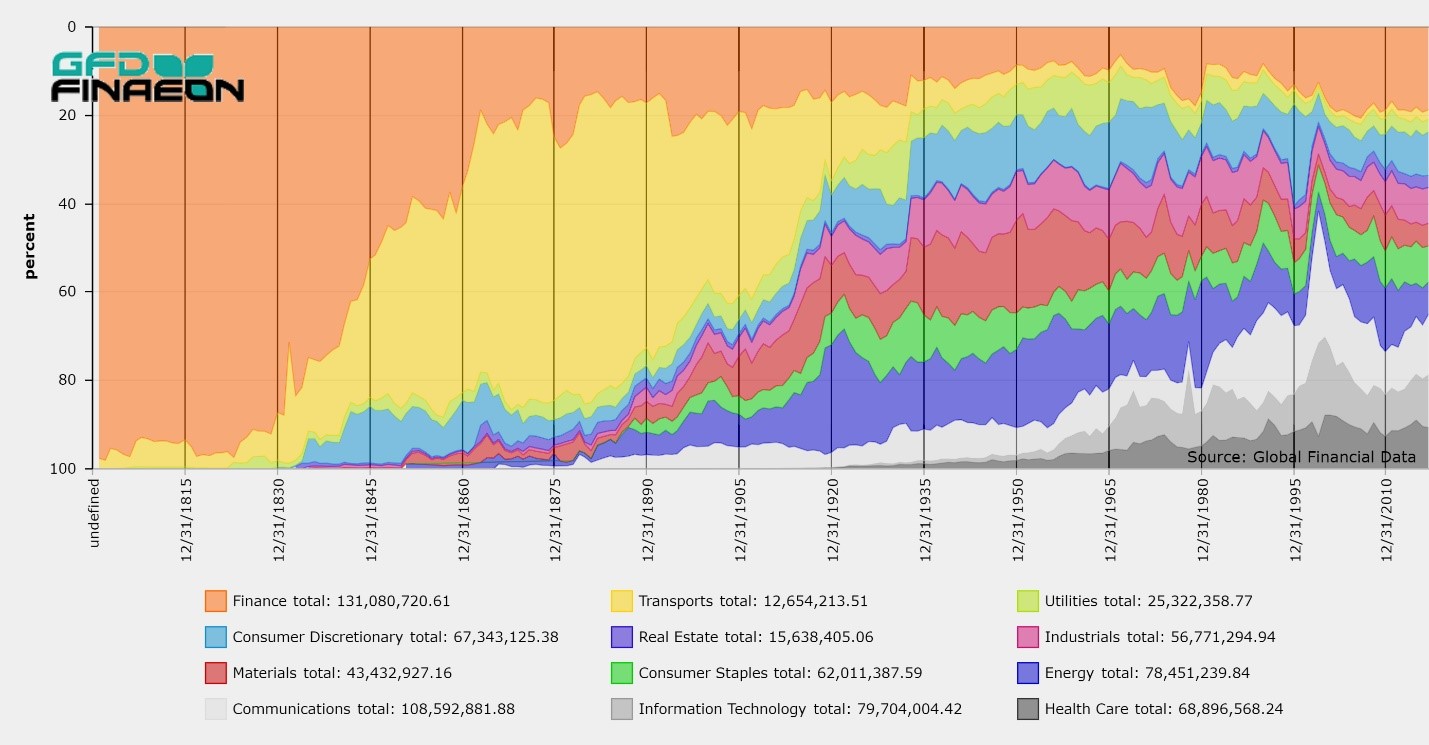
Global Financial Data has put together a unique collection of alternative data indices that chart the performance of stocks in dozens of different countries around the world. The first company for which Global Financial Data has data, the Dutch East India Co., was founded so the Dutch could develop resources in Indonesia and the rest of Asia. This company was followed by the Dutch West India Co., the English East India Company, the French East India Co., the Hudson Bay Co. and dozens of others. Throughout the 1600s and 1700s, developing the resources of emerging markets was the main reason many of these companies existed. During the 1800s, however, European countries established corporations that had the right to build railroads, establish banks, mine, and purchase and develop land. Each country established companies to develop resources in their colonies, Britain in India and Australia, the Netherlands in Indonesia (Netherlands Indies), France in French Indochina and French West Africa, Belgium in the Congo, and so forth. Today, if you want to invest in Emerging Markets, you can either buy an ETF that specializes in a particular country or region, or you can purchase ADRs that provide you ownership in that company. In the 1800s, there were no ETFs that allowed you to invest in different colonies or regions, but you could buy shares in companies that invested in emerging markets. These shares were liquid and readily available on the London Stock Exchange. There were numerous bubbles that attracted British and other investors to emerging markets before World War I. The first occurred in 1825 when Latin American companies caught the eyes of investors. French railroads raised money in London in the 1840s, Australian mining stocks exploded in 1852, American railroads attracted investors in the 1870s and 1880s and in the 1890s, South African gold mining companies traded on the London, Paris and Berlin stock exchanges. The Suez Canal was one of the largest companies that listed in Paris and the Panama Railroad was a prime subject of speculation in the 1850s as gold diggers made their way from the east coast of America to California. The London Stock Exchange is so rich in its history that you might feel like an archaeological explorer who has discovered Tutankhamun’s tomb once you start investigating the data. In most of the countries, shares listed in London before stock exchanges established in those countries. Since the gold standard fixed exchange rates between European countries after 1870, shares of American railroads or South African mining companies traded simultaneously in London, Paris, Amsterdam, Berlin, Brussels and Vienna. Until 1914, buying and selling government bonds or the bonds of American railroads was one of the principal ways that money moved between countries to arbitrage exchange rates between European countries. The coverage varies tremendously between different countries. Some countries, such as Costa Rica or Ethiopia, may only have one company that traded in London, but other countries, such as Australia, Malaysia, South Africa or the United States might have over 100 companies that traded in London between 1825 and 1985. Global Financial Data has collected the price of shares, the number of shares outstanding and corporate actions so market cap-weighted price and total return indices can be calculated for each country. The data allows us to calculate indices not only by country, but by region. We can compare the performance of developed and emerging markets as well as by sector. Were emerging markets good investments in the 1800s or poor investments? Did the returns to emerging markets exceed returns to British or American companies? Did people in emerging markets benefit from the railroads, banks, mining and other companies that were developed, or as Marx or Gandhi would have it, did these companies channel all their profits back to European investors and leave nothing for the colonies? Over 2300 companies that listed in the United Kingdom and the United States are included in GFD’s London Stock Exchange indices. Certainly, no one who wants to understand the performance of the stock market in the past or of emerging markets in general should ignore this data. The results can be compared directly with the returns to the United States and United Kingdom using the GFD US-100 and GFD UK-100 indices. The data from London and New York are daily in their periodicity so the exact timing of bull and bear markets can be studied in detail. Once you have analyzed the indices that have been calculated for each country or sector, you can analyze the performance of the underlying companies that make up the indices to discover the sources of changes in the data. The GFD Indices provide a rich resource of alternative data that is available from no other source and can be a rich resource for finding sources of alpha for investors. To help potential users understand the richness of this data set, Table 1 provides information on the indices that have been calculated for each country. The table details when the index for each country begins and when it ends. It tells the number of companies that are included in the indices as well as the maximum market cap of the companies that were listed in London. If you currently do not subscribe to the GFD Indices, you are missing out on a rich opportunity to analyze the past and possibly obtain a better understanding of the performance of emerging markets in the future. Table 1. GFD Indices of Companies Listed in London and New York, 1825 to 1985
Country
Begins
Ends
Companies
Max Market Cap
Year
Argentina
1865
1985
69
749.0
1929
Australia
1825
1985
201
12,550.0
1981
Austria
1856
1932
6
27.0
1906
Belgium
1845
1985
8
21.0
1875
Bolivia
1825
1985
8
100.0
1929
Brazil
1825
1984
60
2,563.0
1984
Canada
1825
1985
100
19,278.0
1976
Chile
1852
1969
46
815.0
1929
China
1882
1930
7
38.0
1925
Colombia
1825
1962
21
33.0
1920
Costa Rica
1886
1932
1
1.3
1890
Cuba
1838
1961
23
135.0
1926
Denmark
1853
1984
4
40.0
1937
Ecuador
1924
1975
1
2.3
1944
Egypt
1856
1969
23
918.0
1929
El Salvador
1887
1985
4
5.4
1978
Ethiopia
1908
1924
1
0.2
1920
France
1801
1985
53
881.0
1890
Germany
1835
1985
17
7,647.0
1985
Ghana
1869
1985
21
175.0
1936
Greece
1839
1930
3
15.0
1911
Guatemala
1923
1963
2
10.0
1956
Guyana
1845
1921
1
0.1
1895
Hong Kong
1865
1985
6
272.0
1969
India
1792
1985
156
530.0
1865
Indonesia
1891
1981
40
157.0
1980
Ireland
1792
1985
87
402.0
1877
Italy
1848
1985
19
78.0
1927
Jamaica
1907
1985
6
3.0
1967
Japan
1907
1985
44
68.0
1913
Kenya
1907
1970
7
31.0
1966
Malaysia
1889
1985
212
3,373.0
1981
Mauritius
1854
1915
5
2.0
1878
Mexico
1824
1985
61
2,112.0
1989
Mozambique
1895
1975
2
3.5
1928
Myanmar
1890
1977
6
95.0
1937
Netherlands
1845
1985
25
19,106.0
1985
New Zealand
1862
1980
32
219.0
1974
Nicaragua
1863
1891
2
3.3
1864
Nigeria
1887
1976
34
53.0
1965
Paraguay
1889
1965
3
10.0
1965
Peru
1825
1975
13
317.0
1968
Philippines
1889
1985
10
954.0
1980
Portugal
1855
1981
8
13.0
1922
Romania
1870
1940
3
10.0
1914
Russia
1865
1932
22
80.0
1917
Singapore
1895
1977
5
6.0
1969
South Africa
1833
1985
379
54,785.0
1980
Spain
1845
1985
21
90.0
1913
Sri Lanka
1842
1984
57
151.0
1927
Sweden
1853
1985
21
334.0
1929
Switzerland
1872
1930
1
0.5
1928
Thailand
1919
1970
2
11.5
1964
Trinidad
1865
1985
8
741.0
1980
Turkey
1856
1930
11
38.0
1929
United States
1821
1985
198
4,584.0
1926
Uruguay
1873
1971
10
30.0
1928
Venezuela
1852
1971
15
305.0
1948
Zimbabwe
1893
1985
43
108.0
1985
REQUEST A DEMO with a GFDFinaeon Specialist
Information
Our comprehensive financial databases span global markets offering data never compiled into an electronic format. We create and generate our own proprietary data series while we continue to investigate new sources and extend existing series whenever possible. GFD supports full data transparency to enable our users to verify financial data points, tracing them back to the original source documents. GFD is the original supplier of complete historical data.
 Global Financial Data has put together a unique collection of alternative data indices that chart the performance of stocks in dozens of different countries around the world. The first company for which Global Financial Data has data, the Dutch East India Co., was founded so the Dutch could develop resources in Indonesia and the rest of Asia. This company was followed by the Dutch West India Co., the English East India Company, the French East India Co., the Hudson Bay Co. and dozens of others. Throughout the 1600s and 1700s, developing the resources of emerging markets was the main reason many of these companies existed. During the 1800s, however, European countries established corporations that had the right to build railroads, establish banks, mine, and purchase and develop land. Each country established companies to develop resources in their colonies, Britain in India and Australia, the Netherlands in Indonesia (Netherlands Indies), France in French Indochina and French West Africa, Belgium in the Congo, and so forth. Today, if you want to invest in Emerging Markets, you can either buy an ETF that specializes in a particular country or region, or you can purchase ADRs that provide you ownership in that company. In the 1800s, there were no ETFs that allowed you to invest in different colonies or regions, but you could buy shares in companies that invested in emerging markets. These shares were liquid and readily available on the London Stock Exchange. There were numerous bubbles that attracted British and other investors to emerging markets before World War I. The first occurred in 1825 when Latin American companies caught the eyes of investors. French railroads raised money in London in the 1840s, Australian mining stocks exploded in 1852, American railroads attracted investors in the 1870s and 1880s and in the 1890s, South African gold mining companies traded on the London, Paris and Berlin stock exchanges. The Suez Canal was one of the largest companies that listed in Paris and the Panama Railroad was a prime subject of speculation in the 1850s as gold diggers made their way from the east coast of America to California. The London Stock Exchange is so rich in its history that you might feel like an archaeological explorer who has discovered Tutankhamun’s tomb once you start investigating the data. In most of the countries, shares listed in London before stock exchanges established in those countries. Since the gold standard fixed exchange rates between European countries after 1870, shares of American railroads or South African mining companies traded simultaneously in London, Paris, Amsterdam, Berlin, Brussels and Vienna. Until 1914, buying and selling government bonds or the bonds of American railroads was one of the principal ways that money moved between countries to arbitrage exchange rates between European countries. The coverage varies tremendously between different countries. Some countries, such as Costa Rica or Ethiopia, may only have one company that traded in London, but other countries, such as Australia, Malaysia, South Africa or the United States might have over 100 companies that traded in London between 1825 and 1985. Global Financial Data has collected the price of shares, the number of shares outstanding and corporate actions so market cap-weighted price and total return indices can be calculated for each country. The data allows us to calculate indices not only by country, but by region. We can compare the performance of developed and emerging markets as well as by sector. Were emerging markets good investments in the 1800s or poor investments? Did the returns to emerging markets exceed returns to British or American companies? Did people in emerging markets benefit from the railroads, banks, mining and other companies that were developed, or as Marx or Gandhi would have it, did these companies channel all their profits back to European investors and leave nothing for the colonies? Over 2300 companies that listed in the United Kingdom and the United States are included in GFD’s London Stock Exchange indices. Certainly, no one who wants to understand the performance of the stock market in the past or of emerging markets in general should ignore this data. The results can be compared directly with the returns to the United States and United Kingdom using the GFD US-100 and GFD UK-100 indices. The data from London and New York are daily in their periodicity so the exact timing of bull and bear markets can be studied in detail. Once you have analyzed the indices that have been calculated for each country or sector, you can analyze the performance of the underlying companies that make up the indices to discover the sources of changes in the data. The GFD Indices provide a rich resource of alternative data that is available from no other source and can be a rich resource for finding sources of alpha for investors. To help potential users understand the richness of this data set, Table 1 provides information on the indices that have been calculated for each country. The table details when the index for each country begins and when it ends. It tells the number of companies that are included in the indices as well as the maximum market cap of the companies that were listed in London. If you currently do not subscribe to the GFD Indices, you are missing out on a rich opportunity to analyze the past and possibly obtain a better understanding of the performance of emerging markets in the future. Table 1. GFD Indices of Companies Listed in London and New York, 1825 to 1985