The U.S. stock market fell into a bear market on March 12, 2020 ending the bull market that began in 2009. The bull market had begun on March 9, 2009 and peaked on February 19, 2020. The S&P 500 rose 400% between 2009 and 2020, the Dow Jones Industrials rose 351% between 2009 and 2020. The NASDAQ Composite fell into a bear market in 2018 when it declined 23%, bounced back 58% between 2018 and February 19, 2020. The NASDAQ has fallen 26% since then.
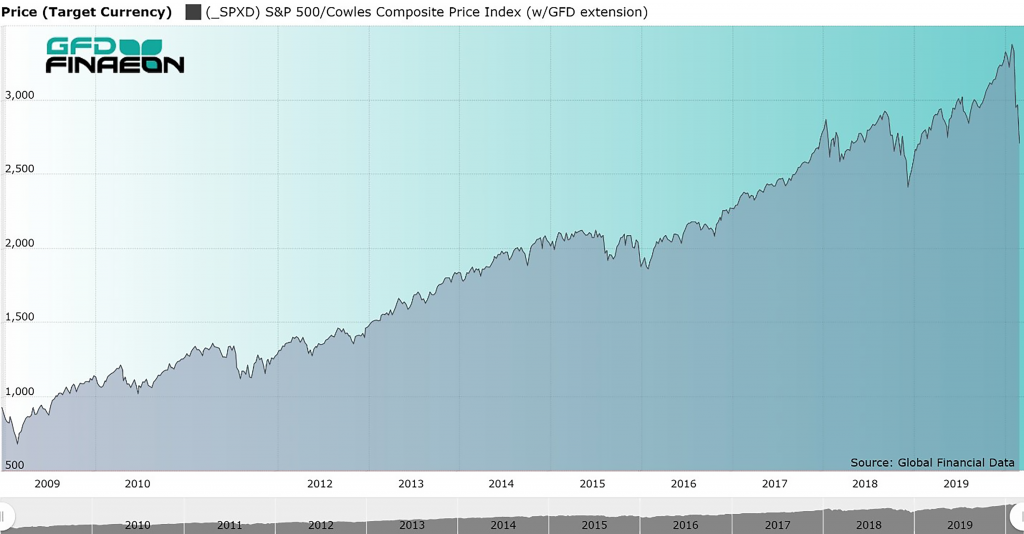 Figure 1. S&P 500, 2009 to 2020
The GFD US-100 Index provides more history than any other stock market index ever developed beginning in the year 1792. By our calculation, there have been twenty-four bull and bear markets since 1792 with four occurring in the 1800s, seventeen in the 1900s and three in the 2000s. The worst bear market was in 1929-1932, led by an 89% decline in the Dow Jones Industrials. The two previous bear markets in this century both had declines of 50% in 2000-2002 and 2007-2009. The 2000 bear market lasted over two years and the 2007 bear market over one year. By comparison, the 1987 and 1990 bear markets only lasted a few months before the market bounced back. What is interesting about this bear market is how quickly it hit and how sharply markets throughout the world have dropped in tandem in response to the Coronavirus epidemic. There was no gradual spread of this financial pandemic. It hit all the world’s stock markets simultaneously. In many countries, the 2020 bear market is a continuation of the bear market that began in 2018.
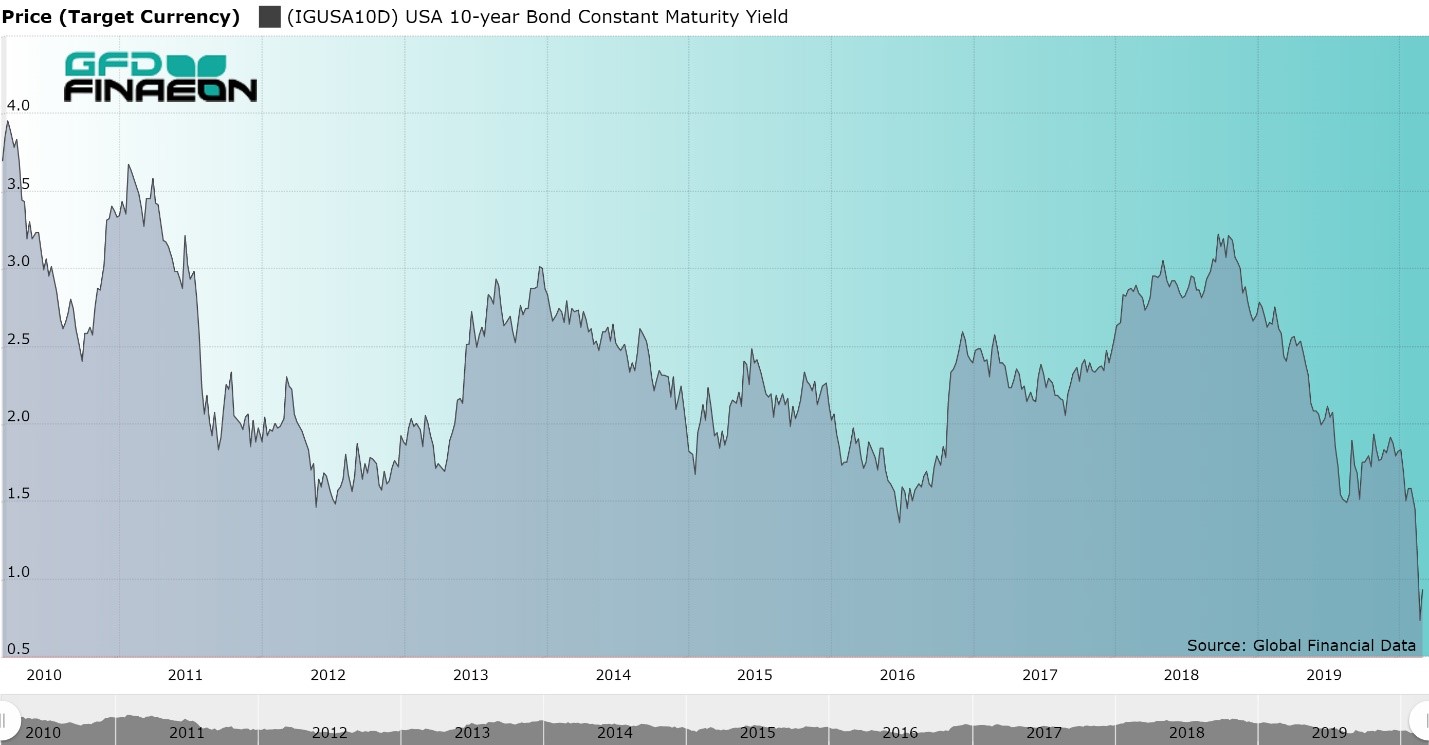 Figure 2. United States 10-year Bond Yield, 2010 to 2020
The extent of the bear market in 22 countries and for global indices is provided in Table 1. The table shows the date of the market top, the value the index hit on that date, the change from the previous market low, the current value of the market, and how much each market has fallen since the top in 2018 or 2020. The only major market in the world which has not fallen into a bear market this year is the Chinese market, the country where the coronavirus originated. However, the Chinese market has been in decline since 2015.
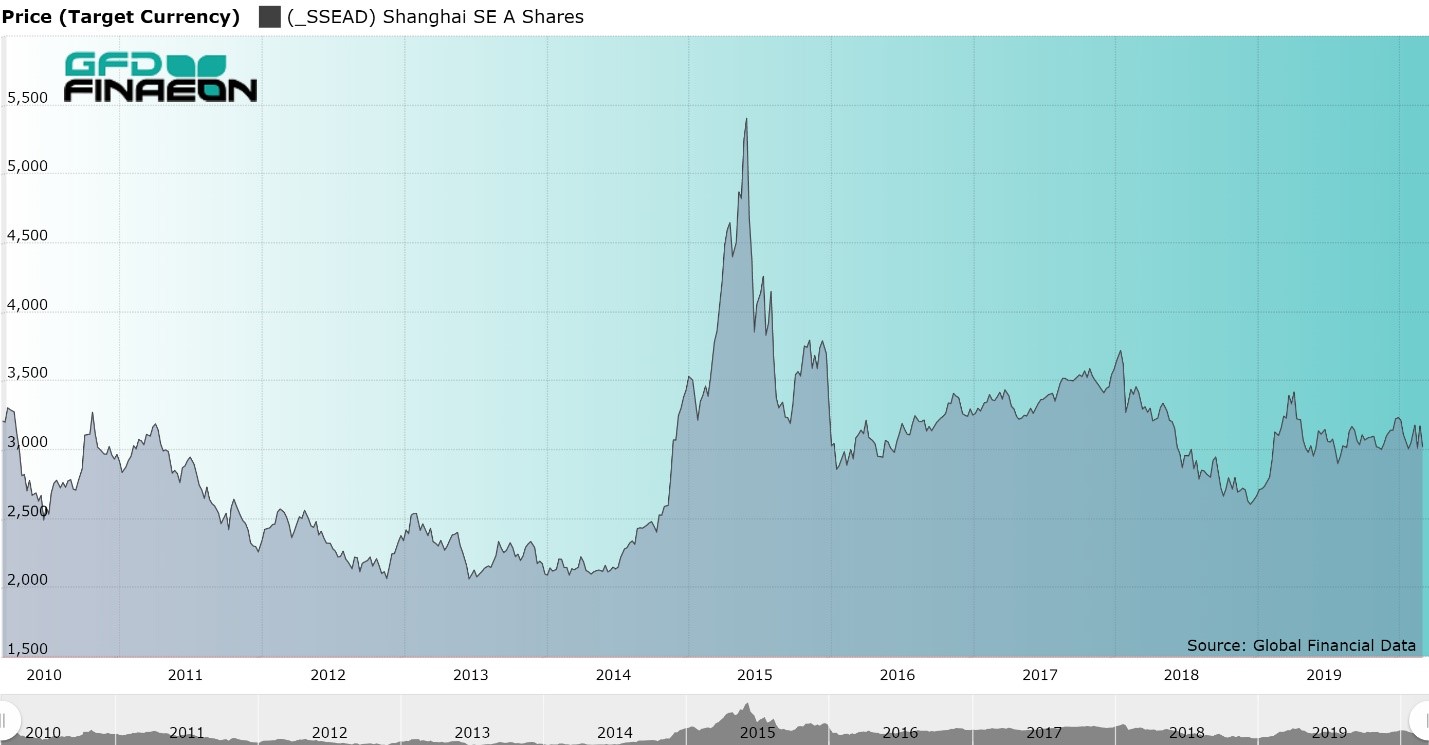 Figure 3. Shanghai Stock Exchange “A” Shares Index, 2010 to 2020
So far, global markets have fallen by around 30-40%. The question is, how much more are the markets likely to fall? Will this be a short-lived bear market as occurred in 1987 and 1990 or a more extended bear market as occurred in 2000-2002 and 2007-2009? It should be noted that fixed-income markets have already hit their bottom. This occurred on March 9 when the 10-year bond yield hit 0.381% and the 30-year bond fell below 1%. Yields have risen since then. Moreover, the Shanghai Index bottomed out on February 3, 2020 when the stock market reopened after the Chinese New Year and has not participated in the worldwide sell off. Both of these are positive signs that the bear market will not continue for an extended period of time. We will update Table 1 on a regular basis so our readers can follow the changes that occur in this bear market.
| Country | Index | Market Top | Value | Change | Market Low | Value | Change |
| Asia | |||||||
| Australia | All-Ordinaries | 2/20/2020 | 7255.2 | 133.16 | 3/23/2020 | 4564.10 | -37.09 |
| China | Shanghai A Shares | 6/12/2015 | 5410.86 | 165.15 | 12/27/2018 | 2600.05 | -51.95 |
| Hong Kong | Hang Seng | 1/26/2018 | 33154.12 | 80.98 | 3/23/2020 | 21696.13 | -32.76 |
| India | BSE Sensex | 1/14/2020 | 41952.63 | 82.79 | 3/23/2020 | 25981.24 | -38.07 |
| Japan | TOPIX | 1/23/2018 | 1911.31 | 59.77 | 3/16/2020 | 1236.34 | -35.31 |
| Singapore | FTSE ST All-Share | 1/24/2018 | 877.87 | 40.38 | 3/23/2020 | 540.60 | -38.42 |
| South Korea | Korea SE Price Index | 1/29/2018 | 2598.19 | 57.21 | 3/19/2020 | 1457.64 | -43.90 |
| Taiwan | Taiwan Weighted | 1/14/2020 | 12179.81 | 56.41 | 3/19/2020 | 8681.34 | -28.72 |
| Europe and Africa | |||||||
| Belgium | All-Share | 4/13/2015 | 13859.94 | 104.31 | 3/18/2020 | 7202.21 | -48.04 |
| France | CAC All-Tradable | 2/12/2020 | 4732.14 | 56.27 | 3/18/2020 | 2888.89 | -38.95 |
| Germany | CDAX Composite | 1/23/2018 | 625.19 | 50.07 | 3/18/2020 | 363.83 | -41.80 |
| Italy | FTSE Italia All-Share | 2/19/2020 | 27675.06 | 39.43 | 3/12/2020 | 16286.37 | -41.15 |
| Netherlands | All-Share Index | 2/12/2020 | 904.31 | 54.15 | 3/18/2020 | 574.88 | -36.43 |
| Norway | OBX Price | 9/25/2018 | 523.06 | 70.44 | 3/16/2020 | 329.67 | -36.92 |
| South Africa | FTSE All-Share | 1/25/2018 | 61684.8 | 246.26 | 3/19/2020 | 37963.00 | -38.46 |
| Spain | Madrid General | 4/13/2015 | 1203.82 | 99.78 | 3/16/2020 | 608.26 | -49.47 |
| Sweden | OMX All-Share Price | 2/19/2020 | 732.67 | 68.35 | 3/23/2020 | 478.95 | -34.63 |
| Switzerland | SPI Price Index | 2/19/2020 | 731.04 | 140.71 | 3/16/2020 | 548.52 | -24.97 |
| United Kingdom | FTSE-100 | 5/22/2018 | 7534.4 | 99.27 | 3/23/2020 | 4993.89 | -33.72 |
| Americas | |||||||
| Brazil | Bovespa | 1/23/2020 | 119528 | 217.51 | 3/23/2020 | 63451.55 | -46.91 |
| Canada | TSE-300 | 2/20/2020 | 17944.1 | 51.52 | 3/23/2020 | 11228.49 | -37.43 |
| Mexico | Mexico IPC | 7/25/2017 | 51713.38 | 206.16 | 3/23/2020 | 32936.60 | -36.31 |
| United States | DJIA | 2/12/2020 | 29551.42 | 351.37 | 3/23/2020 | 18576.04 | -37.14 |
| United States | S&P 500 | 2/19/2020 | 3386.15 | 400.52 | 3/23/2020 | 2236.7 | -33.95 |
| United States | NASDAQ | 2/19/2020 | 9817.18 | 58.52 | 3/23/2020 | 6860.67 | -30.12 |
| Global | |||||||
| Emerging Markets | MSCI Emerging Free | 1/29/2018 | 1278.53 | 85.69 | 3/23/2020 | 758.204 | -40.70 |
| Europe | MSCI Europe | 1/25/2018 | 1926.57 | 47.52 | 3/23/2020 | 1152.698 | -40.16 |
| World | MSCI World | 2/12/2020 | 2434.95 | 35.63 | 3/23/2020 | 1602.105 | -34.20 |
| World | MSCI EAFE | 1/25/2018 | 2186.65 | 46.52 | 3/23/2020 | 1354.30 | -38.07 |