 Today Pepsi is one of the strongest brands in the world with a capitalization of nearly $125 billion. But this wasn’t always the case. It may be hard to believe, but Pepsi was on the verge of bankruptcy during its first forty years of business. In fact, Pepsi-Cola’s financial situation was so bad that three times between 1922 and 1934, Pepsi-Cola approached Coca-Cola and offered to sell out to their competitor. All three times Coca-Cola rejected their offer.
Coca-Cola’s rejections could be among three of the biggest marketing snafus in history, while Pepsi’s “12 ounce” jingle campaign turned out to be one of the most successful marketing efforts of all time.
Not only did the campaign prove a success for Pepsi, but it revolutionized the soda industry as a whole. This case study is an interesting one indeed and shows how perseverance in the marketplace and promotional advertising can be worth billions.
Today Pepsi is one of the strongest brands in the world with a capitalization of nearly $125 billion. But this wasn’t always the case. It may be hard to believe, but Pepsi was on the verge of bankruptcy during its first forty years of business. In fact, Pepsi-Cola’s financial situation was so bad that three times between 1922 and 1934, Pepsi-Cola approached Coca-Cola and offered to sell out to their competitor. All three times Coca-Cola rejected their offer.
Coca-Cola’s rejections could be among three of the biggest marketing snafus in history, while Pepsi’s “12 ounce” jingle campaign turned out to be one of the most successful marketing efforts of all time.
Not only did the campaign prove a success for Pepsi, but it revolutionized the soda industry as a whole. This case study is an interesting one indeed and shows how perseverance in the marketplace and promotional advertising can be worth billions.
A Secret Recipe: Pepsin and Kola Nuts
First introduced in North Carolina as “Brad’s Drink” in 1893 by Caleb Bradham, the name was changed to Pepsi-Cola in 1898 mainly because of Pepsi’s secret ingredients. Digestive enzymes named pepsin and kola nuts were used in the creation of this special drink. However, when Bradham unsuccessfully speculated on wildly fluctuating sugar prices (shown below), the company faced bankruptcy.
A series of buyouts and structural re-organizations occurred between 1922 and 1934. In 1931, the National Pepsi-Cola Co. reorganized as Pepsi-Cola Co., selling its assets to Roy C. Megargel. After Megargel also failed to make Pepsi-Cola Co. profitable, he sold the company to Charles Guth, President of Loft, Inc. Loft, a candy manufacturer and retailer that owned Happiness Candy Stores had been around for 20 years prior to acquiring Pepsi . The Loft-operated Happiness Candy Stores had soda fountains and saw the marriage as a good fit.
Pepsi– Rejected by Coke, Acquired by Loft

Losses and Loft Suits
Where there are losses, there are law suits. Claiming that the companies had been mismanaged, shareholders sued Happiness Candy Stores, Inc. as well as Loft, Inc. Loft, Inc. sued Guth since he had used the finances and facilities of Loft, Inc. to help Pepsi-Cola, Co. succeed.
Guth not only increased Pepsi’s profits by selling the syrup to his former employer, but he made one of the most brilliant marketing decisions in history. He had the excellent idea of packaging Pepsi-Cola in twelve-ounce bottles rather than 6.5 ounce bottles while keeping the price the same at five cents. Coca-Cola and other soft drinks were then sold in 6.5 ounce bottles at the same price. Guth introduced the clever jingle “Pepsi-drink for you”. As a result, Pepsi’s sales increased and profits doubled between 1936 and 1938. Pepsi stock soared, rising one-hundred-fold within two years, as shown in the chart below:


Loft, Inc. may not have been able to run a candy business or a candy store business profitably, but they did know how to win a lawsuit. When Guth v. Loft, Inc. was decided in Loft’s favor, the company was saved. The real question was how to turn all of these law suits for and against Loft, Inc. to the company’s advantage. E. A. Le Roy Jr., President of Loft, Inc., made a series of brilliant moves that not only resolved all of the law suits, but put Pepsi on the road to becoming a hundred-billion dollar company.
First, Le Roy spun off the Happiness Candy Stores, Inc. He eliminated the $1.5 million owed to Loft, Inc. by Happiness Candy Stores, Inc., absorbed the candy store, of which the company owned over 70%, then spun the company off to shareholders as Loft Candy Stores, Inc. The loss-making candy business was eliminated from the company.

Compare this performance with that of Loft, Inc. whose stock had fallen from $25 in 1919 to $2 when the company established its 80% ownership of Pepsi-Cola, Co. The stock rose to $22 by the time the reverse acquisition of Pepsi-Cola Co. occurred on June 30, 1941. The story of the Happiness Candy Stores was similar, with its stock falling from $25 in 1919 to $0.125 in 1941 when the company ceased to exist.
Today, Pepsi is one of the strongest brands in the world. Had it not been for the decisions of Charles Guff and E. A. Le Roy Jr., Pepsi might have met the same fate of Loft Candy, to become something you only read about on the Internet. Of course, PepsiCo had to make many good corporate decisions over the past 75 years to bring the company to the point it is at today, but you have to admire the way Guth and Le Roy turned around a loss-making company to become one global giant. Along with Coca-Cola, Pepsi dominates the soft drink business worldwide and shows no signs of slowing down.

 Yields on United States 10-year bonds rose above 3% at the beginning of January. The yield on the 10-year had reached its lowest point in history in July 2012 at 1.43% as a result of the Fed’s policy of Quantitative Easing. Since then yields have doubled as markets have incorporated the impact of the Fed tapering their purchase of U.S. Government securities.
This raises the question, how high could interest rates go from here? Could interest rates move up to 3% per quarter? U.S. interest rates were that high back in 1981 when the yield on US 10-year Treasuries hit 15.84% and 30-year mortgage rates hit 18.63%.
What about 3% per month? That works out to 42% per annum compounded. Although interest rates have never been that high in the United States, they have been that high in other countries. The yields on 3-year bonds in Mexico were over 50% back in the 1990s. Other countries, mainly in the developing world where inflation was more common in the 1970s to the 1990s also experienced double or triple digit interest rates.
Yields on United States 10-year bonds rose above 3% at the beginning of January. The yield on the 10-year had reached its lowest point in history in July 2012 at 1.43% as a result of the Fed’s policy of Quantitative Easing. Since then yields have doubled as markets have incorporated the impact of the Fed tapering their purchase of U.S. Government securities.
This raises the question, how high could interest rates go from here? Could interest rates move up to 3% per quarter? U.S. interest rates were that high back in 1981 when the yield on US 10-year Treasuries hit 15.84% and 30-year mortgage rates hit 18.63%.
What about 3% per month? That works out to 42% per annum compounded. Although interest rates have never been that high in the United States, they have been that high in other countries. The yields on 3-year bonds in Mexico were over 50% back in the 1990s. Other countries, mainly in the developing world where inflation was more common in the 1970s to the 1990s also experienced double or triple digit interest rates.
The Impact of Hyperinflation
Interest rates at that level can only occur because of inflation. The problem is that as inflation rates rise, they become more unstable and unpredictable. Consequently, the maturity of debt instruments shrinks as the uncertainty increases. Annual interest rates become meaningless, and the maturity shrinks to months or days. What about 3% per week? At this level, the compounding of interest rates takes over. An interest rate of 3% per week works out to 365% per annum. Interest rates rose significantly beyond even this level during the German hyperinflation of 1923. The interest rate charged at the Berlin Stock Exchange in October 1923 hit a high of 7950%, the equivalent of 9% per week. Although this interest rate is high enough to even make a Payday Loan store blanch, it didn’t even come close to compensating for the inflation that occurred in October 1923. The monthly inflation rate in Germany during October 1923 was 24,380%, which far exceeded the 45% monthly interest rate implied by the 7950% interest rate the Berlin Stock Exchange charged. During that month, the US Dollar exchange rate went from 242 million Marks to the USD on October 1, 1923 to 100 billion Marks by November 1, 1923.Investors and Speculators Get Wiped Out
At these levels of hyperinflation, interest rates become meaningless. When prices are rising at the rate of 30% per day, as occurred during Germany in October 1923, fixed-income assets are completely wiped out by the inflation, and no one will deposit or lend cash that will become worthless in a few days. During hyperinflations, the future ceases to exist and cash becomes the only medium of exchange as the value of assets with a maturity over a few days is completely wiped out. Interestingly enough, government bonds rose in price along with inflation during 1923 in Germany. The German 3% bond paying 3 marks in interest actually traded for 37 million Marks in September 1923, right before the inflation came to an end. This provided a yield on the bond of less than one-ten millionth of a percent (i.e. 0.0000001%). The price on the bond had risen from 475,000 Marks just one month before, and a chart of the stock is illustrated below.
Why, you might ask, would someone pay 37 million Marks for a bond that pays 3 marks in interest? The answer is easy, speculators were hoping that once the inflation was over, the government would redeem the bonds at their inflation adjusted value. The people buying the 3% Perpetuities of Germany thought the government would revalue the bonds providing them with both a hedge against hyperinflation as well as a huge profit.

The German government decided that all outstanding bonds would be redenominated at one-tenth Pfennig on the Mark. In other words, a government bond that had originally been issued at 100 Marks was now worth 10 Pfennig. In effect, investors lost 99.9% of their investment. The price of the bond traded up from there to reflect higher interest rates after the inflation was over with, but the difference was small.
The German bonds also traded in London where the price reflected the devaluation of the currency. The value of the bonds on the London Stock Exchange fell from 100 Pounds to 5 shillings (25 pence), a loss of almost 99.9%.
 So far in 2014, emerging markets have significantly underperformed Developed Markets. Turkey has been forced to raise their interest rates dramatically to defend the Lira while Argentina saw a collapse in its own currency. The Fed is expected to continue to taper in 2014, reducing the flow of funds to Emerging Markets and causing them to further weaken relative to Developed Markets. The MSCI Emerging Markets Index has failed to break above its 2011 highs and could soon break critical support right below 900. How long can this continue?
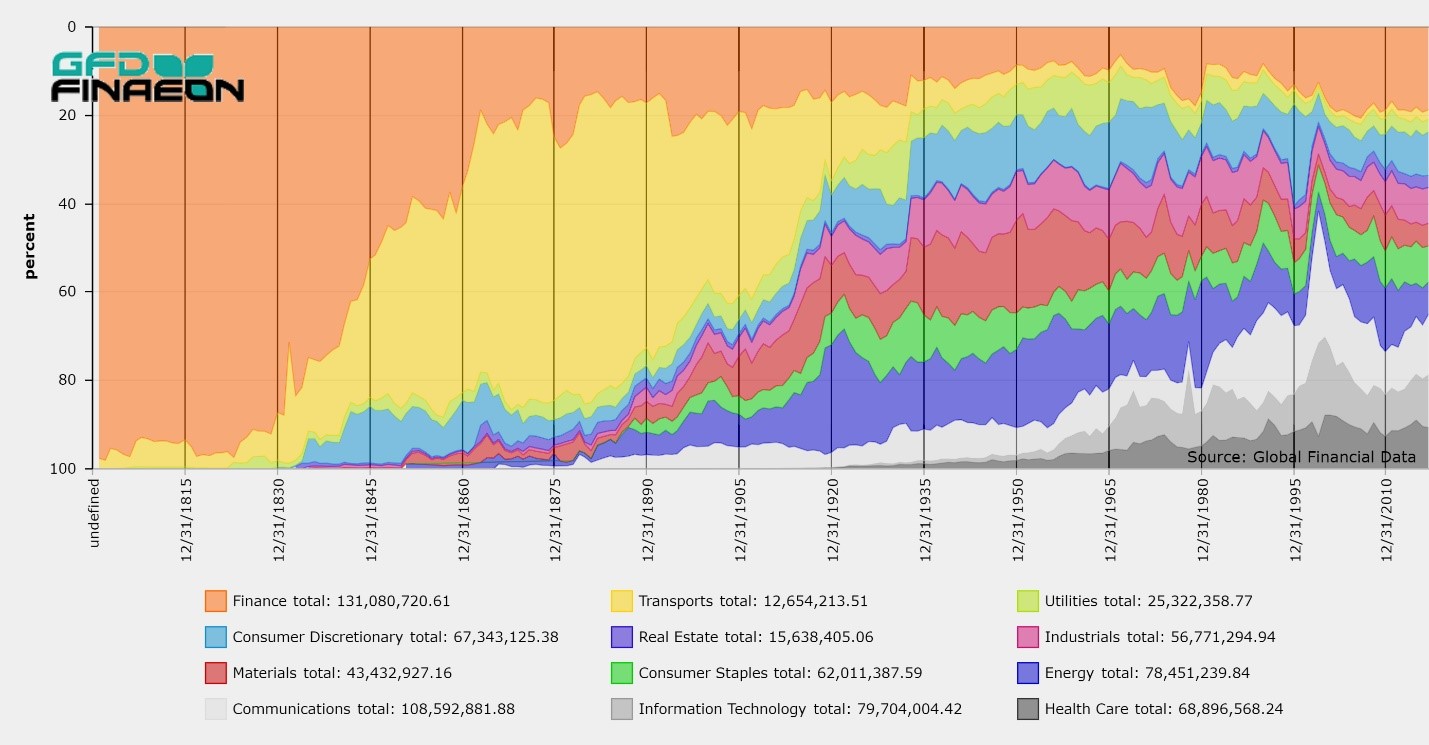
The chart below shows the long-term relative performance of Emerging markets relative to Developed Markets. Global Financial Data has extended the MSCI Developed and MSCI Emerging Markets back to the 1920s so their long-term interaction can be analyzed.
So far in 2014, emerging markets have significantly underperformed Developed Markets. Turkey has been forced to raise their interest rates dramatically to defend the Lira while Argentina saw a collapse in its own currency. The Fed is expected to continue to taper in 2014, reducing the flow of funds to Emerging Markets and causing them to further weaken relative to Developed Markets. The MSCI Emerging Markets Index has failed to break above its 2011 highs and could soon break critical support right below 900. How long can this continue?
The chart below shows the long-term relative performance of Emerging markets relative to Developed Markets. Global Financial Data has extended the MSCI Developed and MSCI Emerging Markets back to the 1920s so their long-term interaction can be analyzed.
As can be seen by the chart, the Emerging-Developed Equity Cycle lasts around seven to ten years. Developed markets outperformed Emerging Markets from 1945-1968, 1979-1986, 1994 to 2001 and since the beginning of 2010. Emerging Markets outperformed Developed Markets between 1968-1979, 1986-1994, and from 2001 to 2010.
We are now four years into the current market cycle. Based upon the past, you would expect the current underperformance of Emerging Markets to continue until 2017 or 2020 at the latest when the trend would reverse itself.

 Global Financial Data is proud to announce the addition of almost 40,000 files that our subscribers can now access. The source of the data is the World Bank, which has made their data archives available to all users. These files cover every country in the world, and a wealth of topics from the environment to the economy. All the data files are annual with some providing data back to 1960.
Global Financial Data has gone through these series and chosen the ones that would be most useful to our subscribers. The focus has been on choosing series that provide long-term data and supplement the 20,000 series in the original GFDatabase and the 45,000 series we provide from Eurostat. Between these three databases, subscribers now have access to over 100,000 data series that cover the world.
Included in the series GFD has chosen are new series providing data on Gross Domestic Product, Exports and Imports, Debt, Education, Technology, the Environment, Health Care, Trade Barriers, Infrastructure, Defense and Income Distribution. In addition to these areas, we have expanded coverage of topics traditionally covered by the GFDatabase including Interest Rates, Price Indices, the Stock Market, Monetary Aggregates, Population, and Exchange Rates.
To highlight the World Bank Data, we provide a separate tab in our Search Engine so you can find topics that will help you to do your research. If you would like, we would be happy to send you an Excel file with information on the series that have been added.
Global Financial Data plans to provide a new release of data each month to its subscribers to the GFDatabase, US Stock Database and UK Stock Database. We will provide updates on these releases both through our blog and through e-mails. If you have any questions about these releases, please feel free to contact your sales representative.
Global Financial Data is proud to announce the addition of almost 40,000 files that our subscribers can now access. The source of the data is the World Bank, which has made their data archives available to all users. These files cover every country in the world, and a wealth of topics from the environment to the economy. All the data files are annual with some providing data back to 1960.
Global Financial Data has gone through these series and chosen the ones that would be most useful to our subscribers. The focus has been on choosing series that provide long-term data and supplement the 20,000 series in the original GFDatabase and the 45,000 series we provide from Eurostat. Between these three databases, subscribers now have access to over 100,000 data series that cover the world.
Included in the series GFD has chosen are new series providing data on Gross Domestic Product, Exports and Imports, Debt, Education, Technology, the Environment, Health Care, Trade Barriers, Infrastructure, Defense and Income Distribution. In addition to these areas, we have expanded coverage of topics traditionally covered by the GFDatabase including Interest Rates, Price Indices, the Stock Market, Monetary Aggregates, Population, and Exchange Rates.
To highlight the World Bank Data, we provide a separate tab in our Search Engine so you can find topics that will help you to do your research. If you would like, we would be happy to send you an Excel file with information on the series that have been added.
Global Financial Data plans to provide a new release of data each month to its subscribers to the GFDatabase, US Stock Database and UK Stock Database. We will provide updates on these releases both through our blog and through e-mails. If you have any questions about these releases, please feel free to contact your sales representative.