Argentina
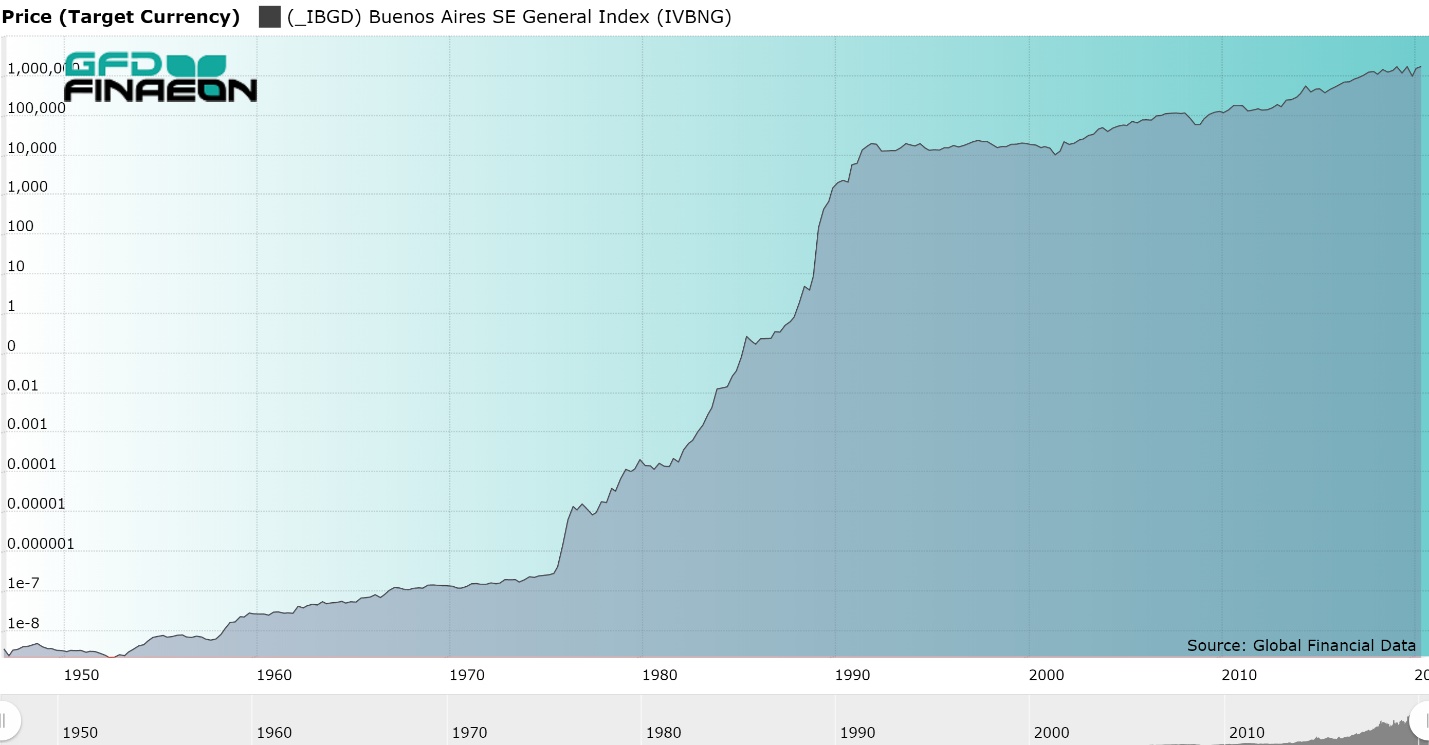
Record Changes
Highest Monthly Average Increase – February (7.54%), January (Up 72.97% of Time)
Lowest Monthly Average Increase – October (1.69%), May, June, July (Up 51.35% of Time)
Greatest Single Monthly Increase – June 1989 (266.70%)
Greatest Single Monthly Decline – June 1947 (-41.72%)
Highest Quarterly Average Increase – April-June (35.92%), December-February (Up 78.38%)
Lowest Quarterly Average Increase – October-December (8.32%), May-July (Up 50.68%)
Australia
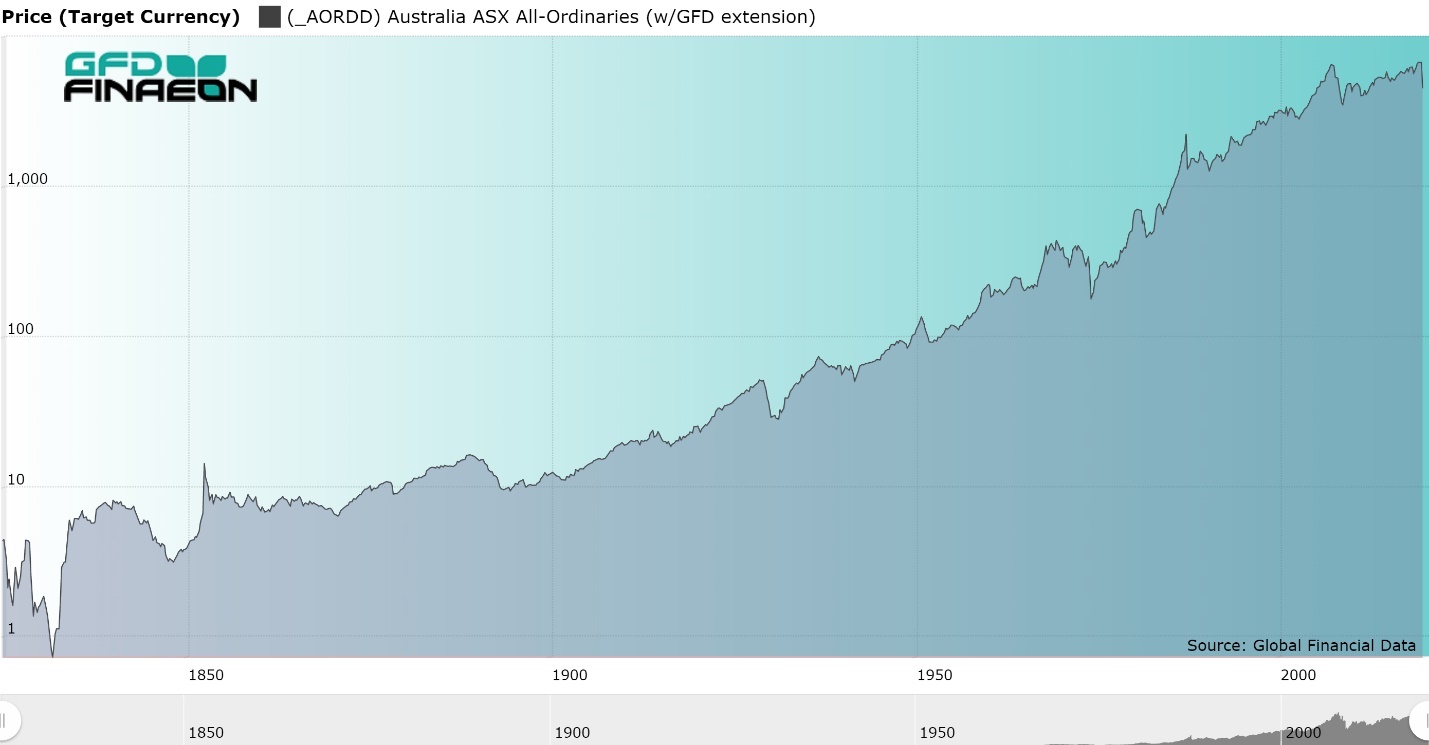
Figure 1. ASX All-Ordinaries with GFD Extension, 1825 to 2020
Record Changes
Highest Monthly Average Increase – December (1.19%), January (Up 65.19% of Time)
Lowest Monthly Average Increase – September (-0.16%), March (Up 50.83% of Time)
Greatest Single Monthly Increase – December 1852 (56.49%)
Greatest Single Monthly Decline – October 1987 (-42.45%)
Highest Quarterly Average Increase – December-February (2.29%, Up 67.40%)
Lowest Quarterly Average Increase – September-November (0.33%), March-May (Up 55.80%)
Highest Monthly Average Increase Since 1900 – January (1.42%, Up 69.23% of Time)
Lowest Monthly Average Increase Since 1900 – September (-0.30%), November (Up 46.96% of Time)
Greatest Single Monthly Increase Since 1900 – October 1930 (21.55%)
Greatest Single Monthly Decline Since 1900 – October 1987 (-42.45%)
Highest Quarterly Average Increase Since 1900 – December-February (2.85%, Up 74.36% of Time)
Lowest Quarterly Average Increase Since 1900 – September-November (0.05%), August-October (Up 52.17% of Time)
Austria
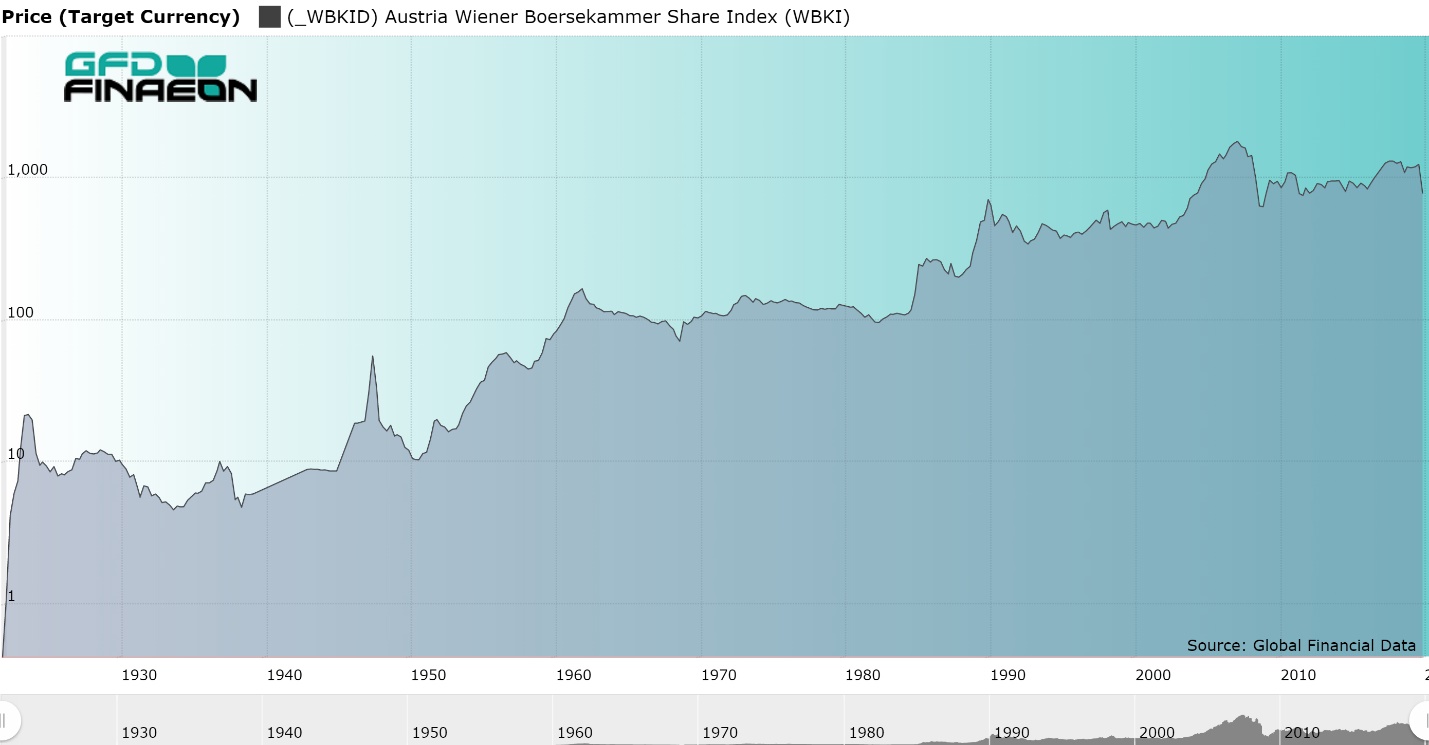
Figure 2. Austrian WBKI Index, 1922 to 2020
Record Changes
Highest Monthly Average Increase – August (2.73%), January (Up 64.21% of Time)
Lowest Monthly Average Increase – March (-0.29%), June (Up 37.89% of Time)
Greatest Single Monthly Increase – August 1922 (215.02%)
Greatest Single Monthly Decline – January 1938 (-32.78%)
Highest Quarterly Average Increase – June-August (7.19%), January-March (Up 61.05% of Time)
Lowest Quarterly Average Increase – September-November (1.63%), May-July (Up 38.30% of Time)
Belgium
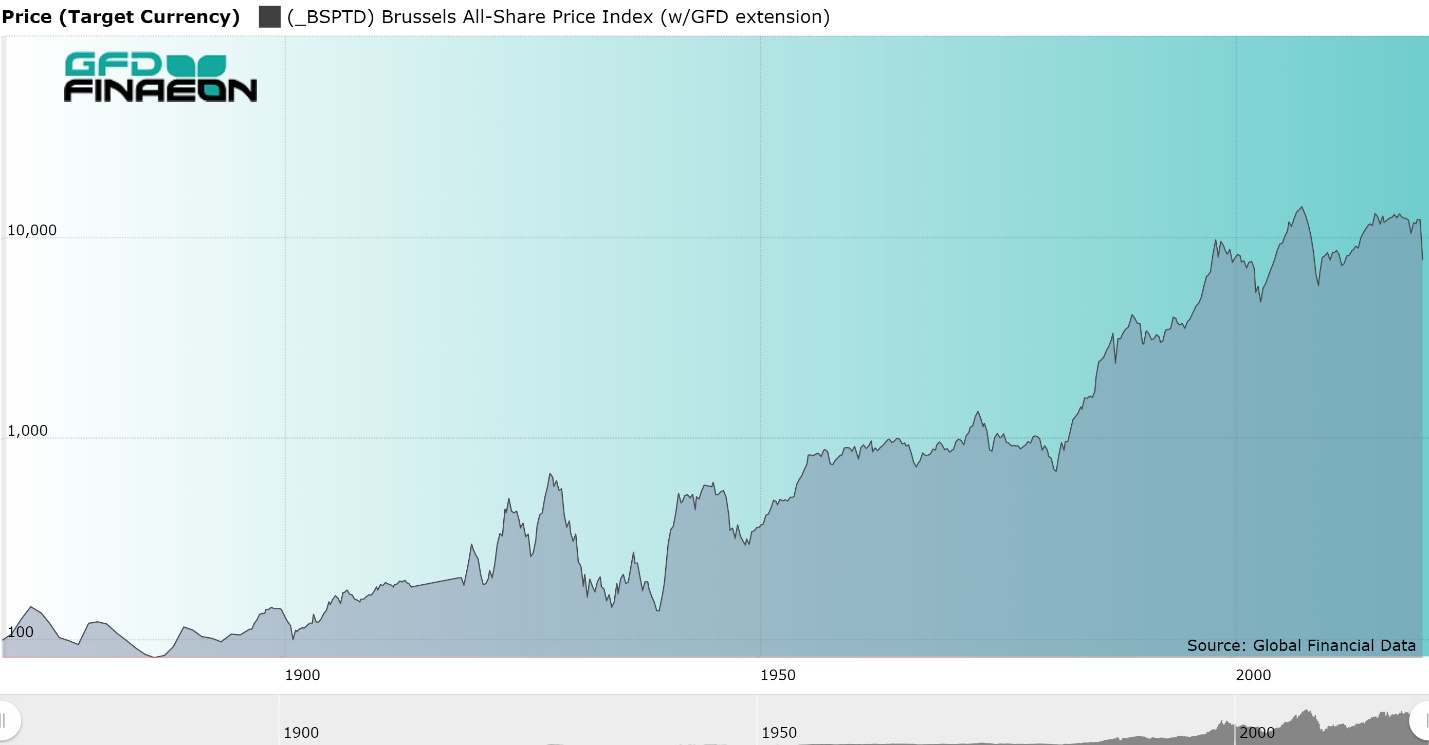
Figure 3. Brussels All-Share Price Index, 1870 to 2020
Record Changes
Highest Monthly Average Increase – February (1.64%), January (Up 65.96% of Time)
Lowest Monthly Average Increase – June (-1.18%, Up 38.71% of Time)
Greatest Single Monthly Increase – April 1935 (26.03%)
Greatest Single Monthly Decline – October 1987 (-22.45%)
Highest Quarterly Average Increase – December-February (4.37%, Up 71.28% of Time)
Lowest Quarterly Average Increase – June-August (-0.88%, Up 47.83% of Time)
Brazil
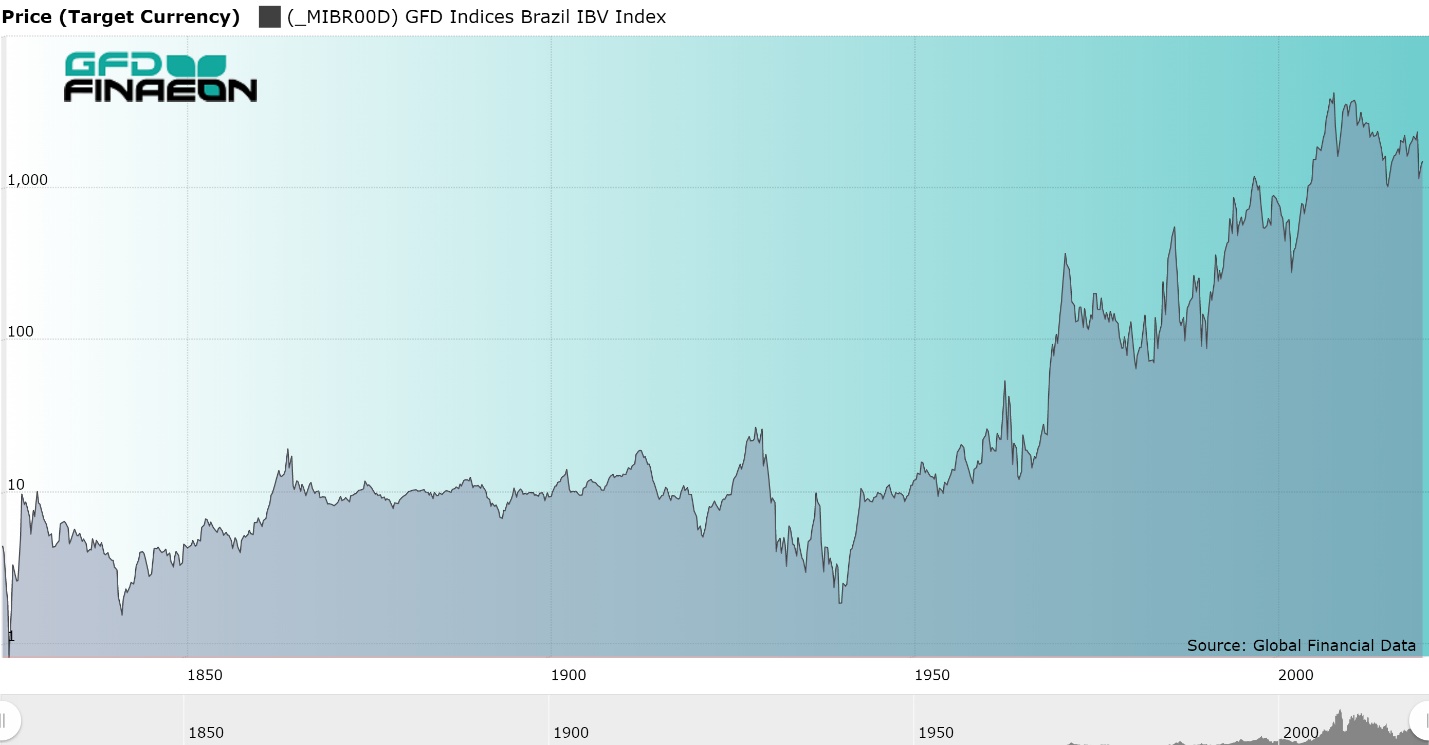
Record Changes
Highest Monthly Average Increase – January (3.22%, Up 63.16% of Time)
Lowest Monthly Average Increase – November (-0.86%, Up 43.53% of Time)
Greatest Single Monthly Increase – April 1990 (81.25%)
Greatest Single Monthly Decline – March 1990 (-66.93%)
Highest Quarterly Average Increase – December-February (5.72%, Up 69.59% of Time)
Lowest Quarterly Average Increase – September-November (0.20%, Up 45.29% of Time)
Highest Monthly Average Increase Since 1900 – January (3.42%, Up 59.50% of Time)
Lowest Monthly Average Increase Since 1900 – November (-1.23%, Up 40.00% of Time)
Greatest Single Monthly Increase Since 1900 – February 1988 (43.67%)
Greatest Single Monthly Decline Since 1900 – November 1987 (-43.19%)
Highest Quarterly Average Increase Since 1900 – December-February (6.87%, Up 69.42% of Time)
Lowest Quarterly Average Increase Since 1900 – September-November (0.39%, Up 47.50% of Time)
Canada
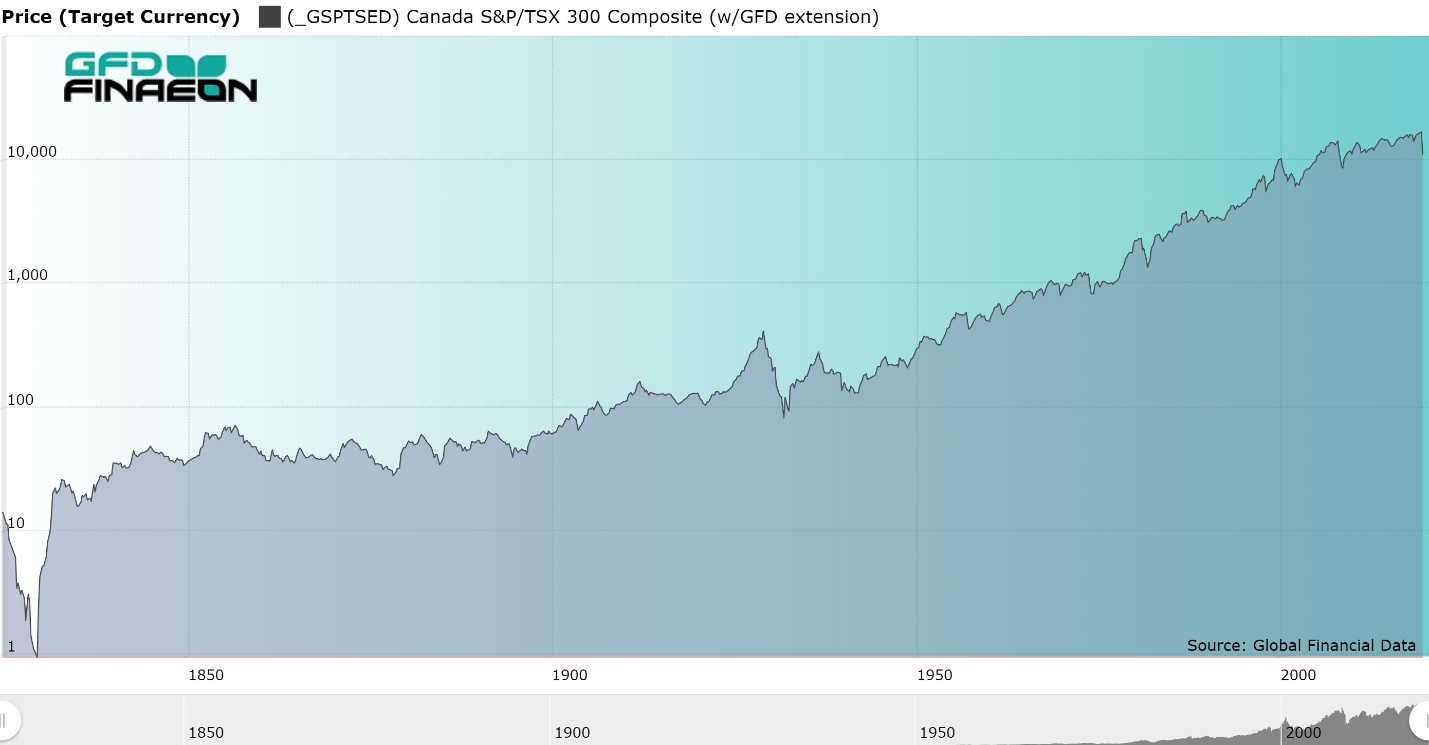
Figure 4. Canada Stock Price Index, 1824 to 2019
Record Changes
Highest Monthly Average Increase – April (2.13%), December (Up 65.24% of Time)
Lowest Monthly Average Increase – June (-0.54%, Up 45.99% of Time)
Greatest Single Monthly Increase – August 1837 (37.75%)
Greatest Single Monthly Decline – May 1932 (-28.44%)
Highest Quarterly Average Increase – February-April (5.86%), November-January (Up 67.55% of Time)
Lowest Quarterly Average Increase – September-November (0.29%), May-July (Up 48.13% of Time)
Highest Monthly Average Increase Since 1900 – January (1.82%), December (Up 71.67% of Time)
Lowest Monthly Average Increase Since 1900 – October (-0.64%), June (Up 46.67% of Time)
Greatest Single Monthly Increase Since 1900 – May 1933 (22.86%)
Greatest Single Monthly Decline Since 1900 – May 1932 (-28.44%)
Highest Quarterly Average Increase Since 1900 – November-January (3.62%, Up 72.73% of Time)
Lowest Quarterly Average Increase Since 1900 – August-October (-0.25%), May-July (Up 55.83% of Time)
Chile
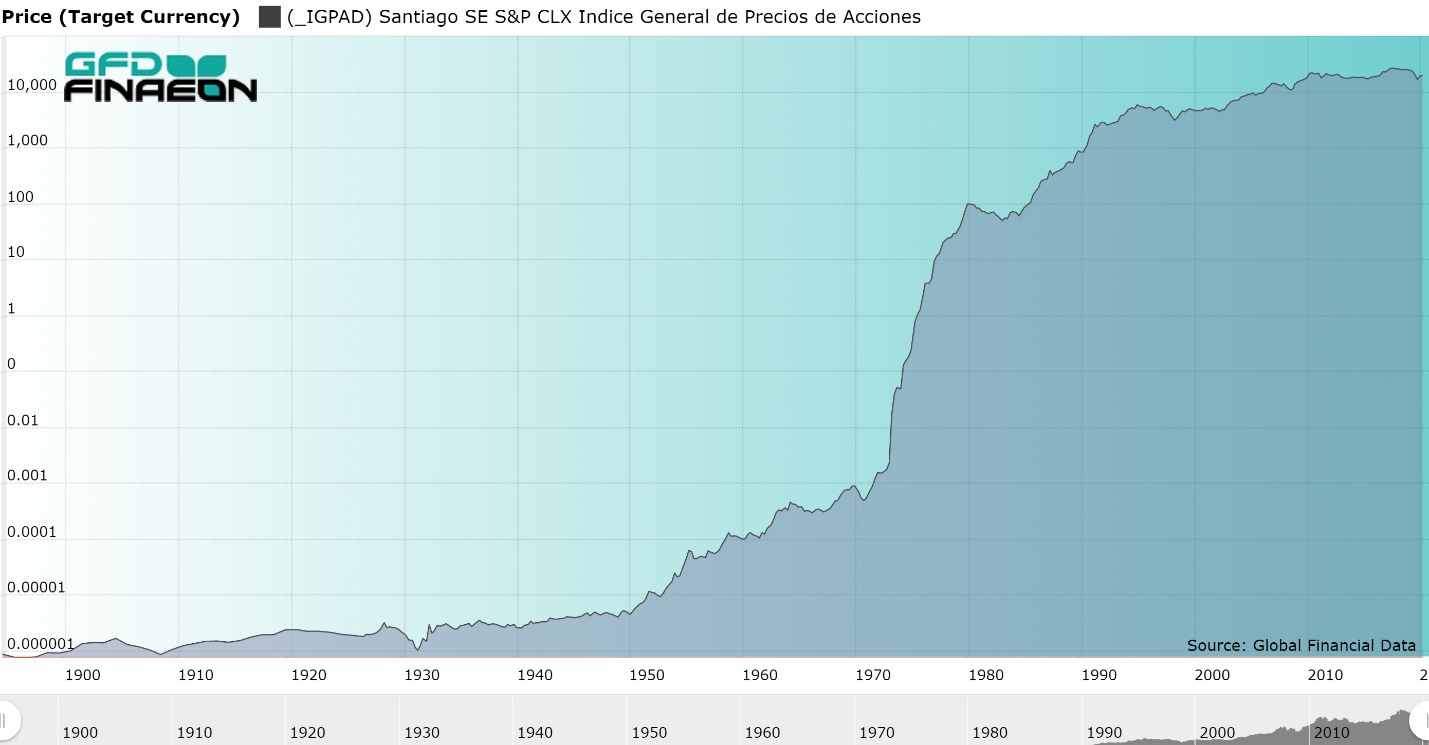
Record Changes
Highest Monthly Average Increase – September (4.49%), February (Up 71.28% of Time)
Lowest Monthly Average Increase – November (0.63%, Up 46.24% of Time)
Greatest Single Monthly Increase – August 1973 (127.95%)
Greatest Single Monthly Decline – September 1970 (-31.31%)
Highest Quarterly Average Increase – July-September (17.40%), January-March (Up 75.53% of Time)
Lowest Quarterly Average Increase – October-December (3.84%, Up 52.69% of Time)
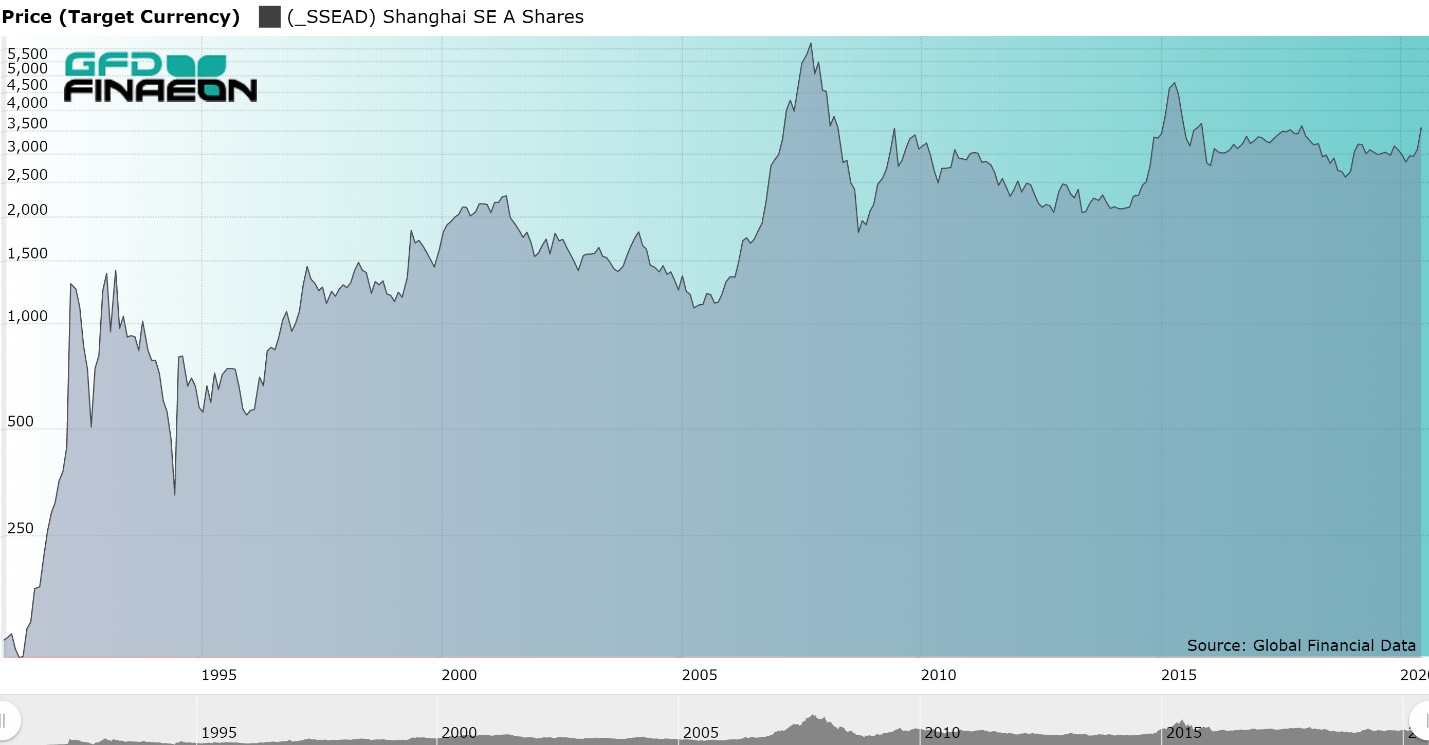
China
Record Changes
Highest Monthly Average Increase – May (5.84%), February (Up 70.00% of Time)
Lowest Monthly Average Increase – July (-1.21%), December (Up 43.33% of Time)
Greatest Single Monthly Increase – May 1992 (189.51%)
Greatest Single Monthly Decline – March 1993 (-31.68%)
Highest Quarterly Average Increase – March-May (12.58%), April (Up 63.33% of Time)
Lowest Quarterly Average Increase – July-September (1.10%, Up 41.38% of Time)
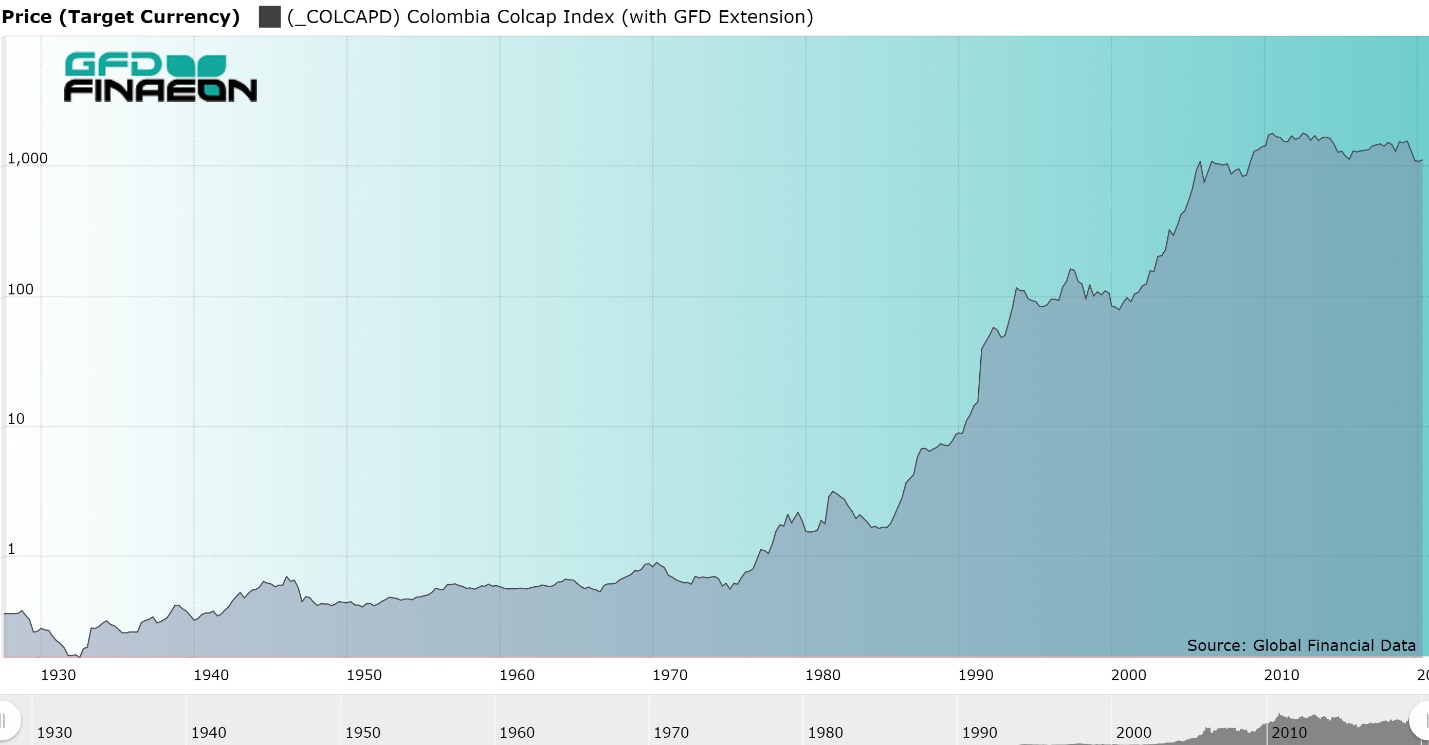
Colombia
Record Changes
Highest Monthly Average Increase – January (3.68%, Up 78.02% of Time)
Lowest Monthly Average Increase – March (-0.49%, Up 45.05% of Time)
Greatest Single Monthly Increase – October 1981 (89.80%)
Greatest Single Monthly Decline – January 1999 (-20.21%)
Highest Quarterly Average Increase – November-January (7.57%, Up 72.53% of Time)
Lowest Quarterly Average Increase – March-May (0.33%, Up 47.25% of Time)
Denmark
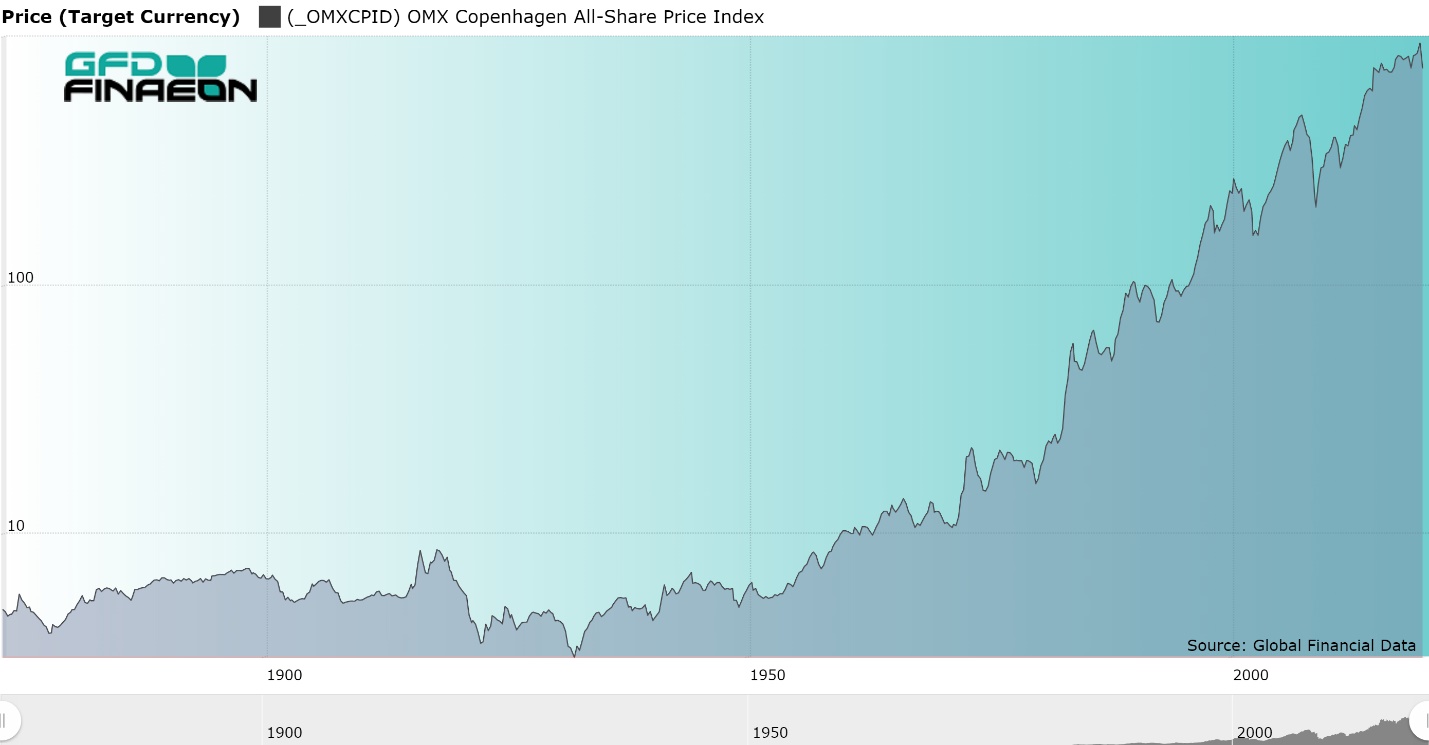
Figure 5. Denmark Stock Price Index, 1873 to 2019
Record Changes
Highest Monthly Average Increase – January (1.91%, Up 82.43% of Time)
Lowest Monthly Average Increase – September (-0.67%, Up 44.90% of Time)
Greatest Single Monthly Increase – January 1925 (18.81%)
Greatest Single Monthly Decline – October 2008 (-18.48%)
Highest Quarterly Average Increase – December-February (3.21%, Up 75.00 % of Time)
Lowest Quarterly Average Increase – September-November (-0.62%, Up 45.58% of Time)
Highest Monthly Average Increase Since 1900 – January (2.14%, Up 82.64% of Time)
Lowest Monthly Average Increase Since 1900 – September (-0.65%), June (Up 48.33% of Time)
Greatest Single Monthly Increase Since 1900 – January 1925 (18.81%)
Greatest Single Monthly Decline Since 1900 – October 2008 (-18.48%)
Highest Quarterly Average Increase Since 1900 – December-February (3.52%, Up 75.21% of Time)
Lowest Quarterly Average Increase Since 1900 – September-November (-0.73%, Up 49.17% of Time)
Finland
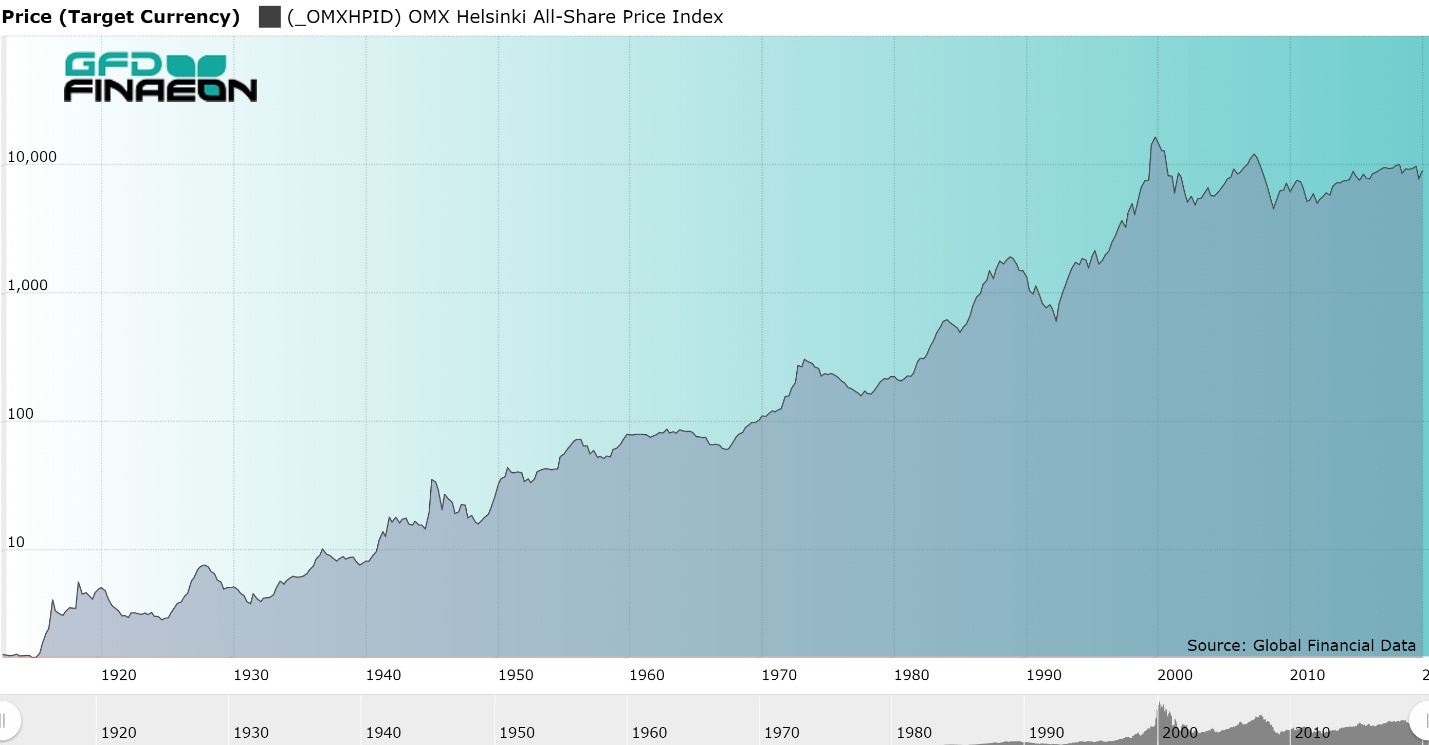
Figure 6. OMX Helsinki All-Share Price Index, 1912-2020
Record Changes
Highest Monthly Average Increase – January (2.67%, Up 75.00% of Time)
Lowest Monthly Average Increase – September (-0.07%), November (Up 46.30% of Time)
Greatest Single Monthly Increase – June 1945 (44.05%)
Greatest Single Monthly Decline – February 2001 (-26.89%)
Highest Quarterly Average Increase – January-March (4.84%), December-February (Up 73.15% of Time)
Lowest Quarterly Average Increase – September-November (0.98%), April-June (Up 50.47% of Time)
France
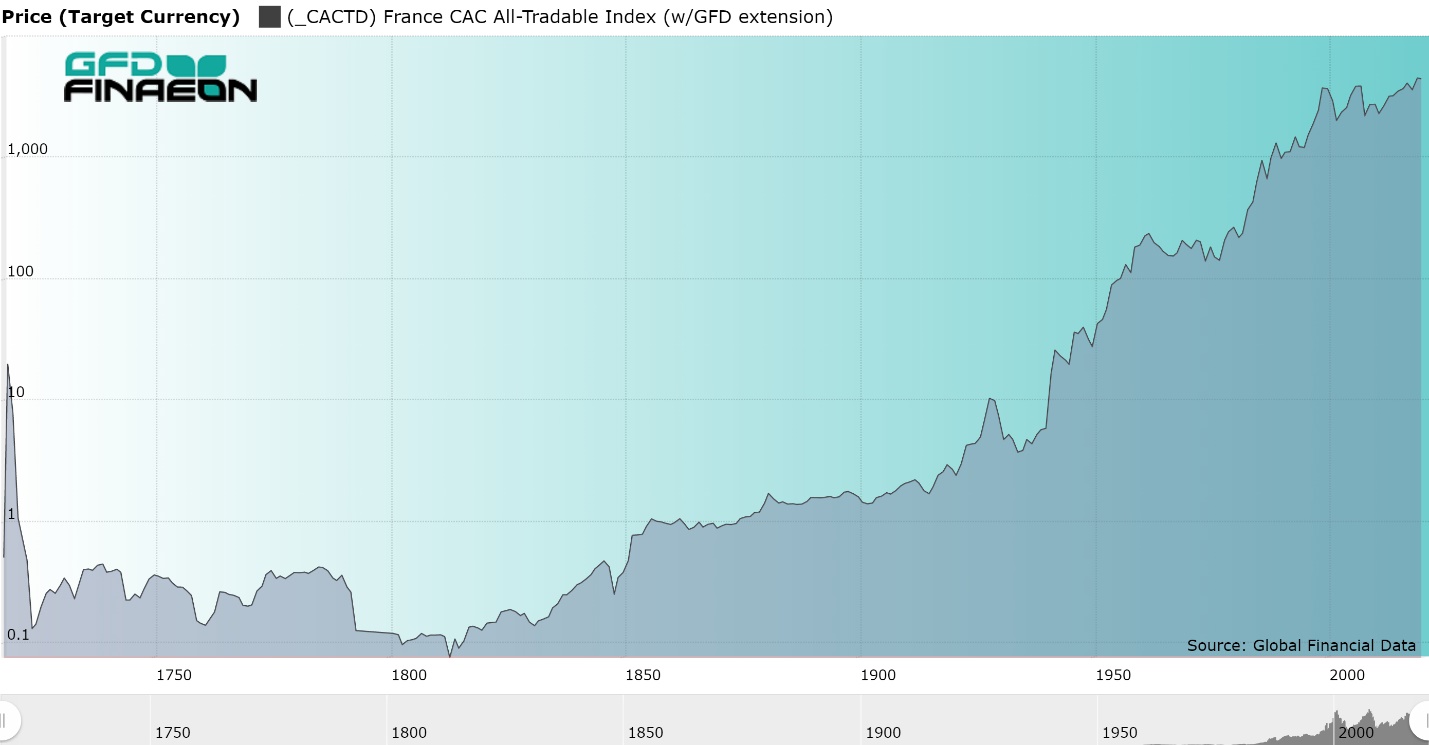
Figure 7. France CAC All-Tradeable Price Index, 1719 to 2019
Record Changes
Highest Monthly Average Increase – August (1.07%, Up 66.51% of Time)
Lowest Monthly Average Increase – June (-0.31%), October (Up 50.00% of Time)
Greatest Single Monthly Increase – May 1814 (43.33%)
Greatest Single Monthly Decline – March 1848 (-55.59%)
Highest Quarterly Average Increase – December-February (3.14%, Up 65.73% of Time)
Lowest Quarterly Average Increase – October-November (0.19%), May-July (Up 53.05% of Time)
Highest Monthly Average Increase Since 1900 – January (2.38%), April (Up 70.69% of Time)
Lowest Monthly Average Increase Since 1900 – June (-1.20%, Up 40.00% of Time)
Greatest Single Monthly Increase Since 1900 – October 1936 (27.45%)
Greatest Single Monthly Decline Since 1900 – October 1987 (-24.12%)
Highest Quarterly Average Increase Since 1900 – December-February (4.57%, Up 70.43% of Time)
Lowest Quarterly Average Increase Since 1900 – May-July (-1.24%, Up 41.23% of Time)
Germany
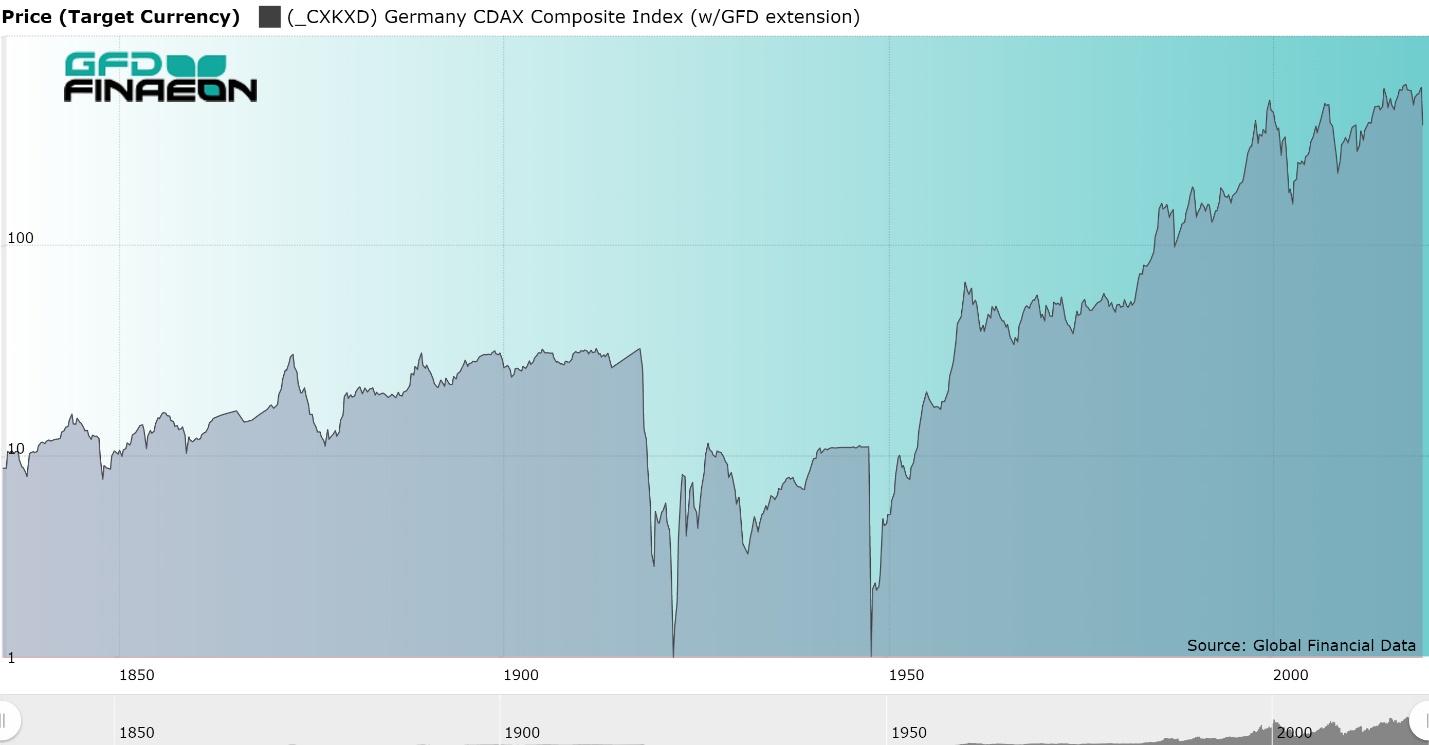
Figure 8. Germany CDAX Stock Returns, 1835 to 2019
Record Changes
Highest Monthly Average Increase – January (1.38%, Up 65.52% of Time)
Lowest Monthly Average Increase – May (-0.63%), October (Up 46.24% of Time)
Greatest Single Monthly Increase – July 1948 (132.24%), November 1923 (53944.44% in Marks vs. 11.99% in Dollars)
Greatest Single Monthly Decline – June 1948 (-89.97%)
Highest Quarterly Average Increase – December-February (3.51%, Up 70.11% of Time)
Lowest Quarterly Average Increase – May-July (-0.16%), September-November (Up 45.09% of Time)
Highest Monthly Average Increase Since 1900 – January (2.06%, Up 73.50% of Time)
Lowest Monthly Average Increase Since 1900 – May (-0.95%), September (Up 46.55% of Time)
Greatest Single Monthly Increase Since 1900 – July 1948 (132.24%), November 1923 (53944.44% in Marks vs. 11.99% in Dollars)
Greatest Single Monthly Decline Since 1900 – June 1948 (-89.97%)
Highest Quarterly Average Increase Since 1900 – December-February (4.54%, Up 73.50% of Time)
Lowest Quarterly Average Increase Since 1900 – May-July (-0.53%, Up 45.30% of Time)
Hong Kong
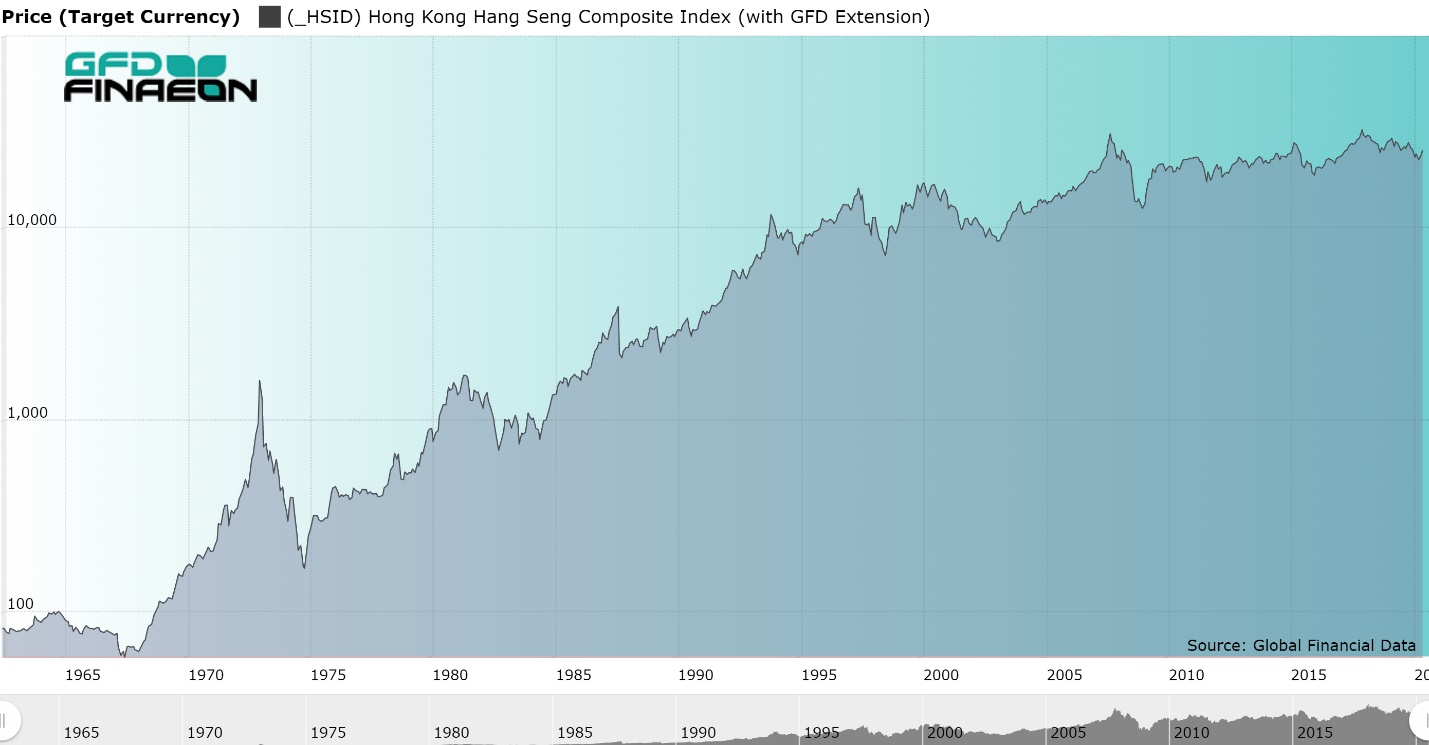
Record Changes
Highest Monthly Average Increase – December (3.28%), April (Up 74.14% of Time)
Lowest Monthly Average Increase – March (-1.75%), August (Up 43.10% of Time)
Greatest Single Monthly Increase – February 1973 (67.27%)
Greatest Single Monthly Decline – April 1973 (-43.52%)
Highest Quarterly Average Increase – December-February (9.26%), October-December (Up 72.41% of Time)
Lowest Quarterly Average Increase – July-September (1.16%, Up 53.45% of Time)
India
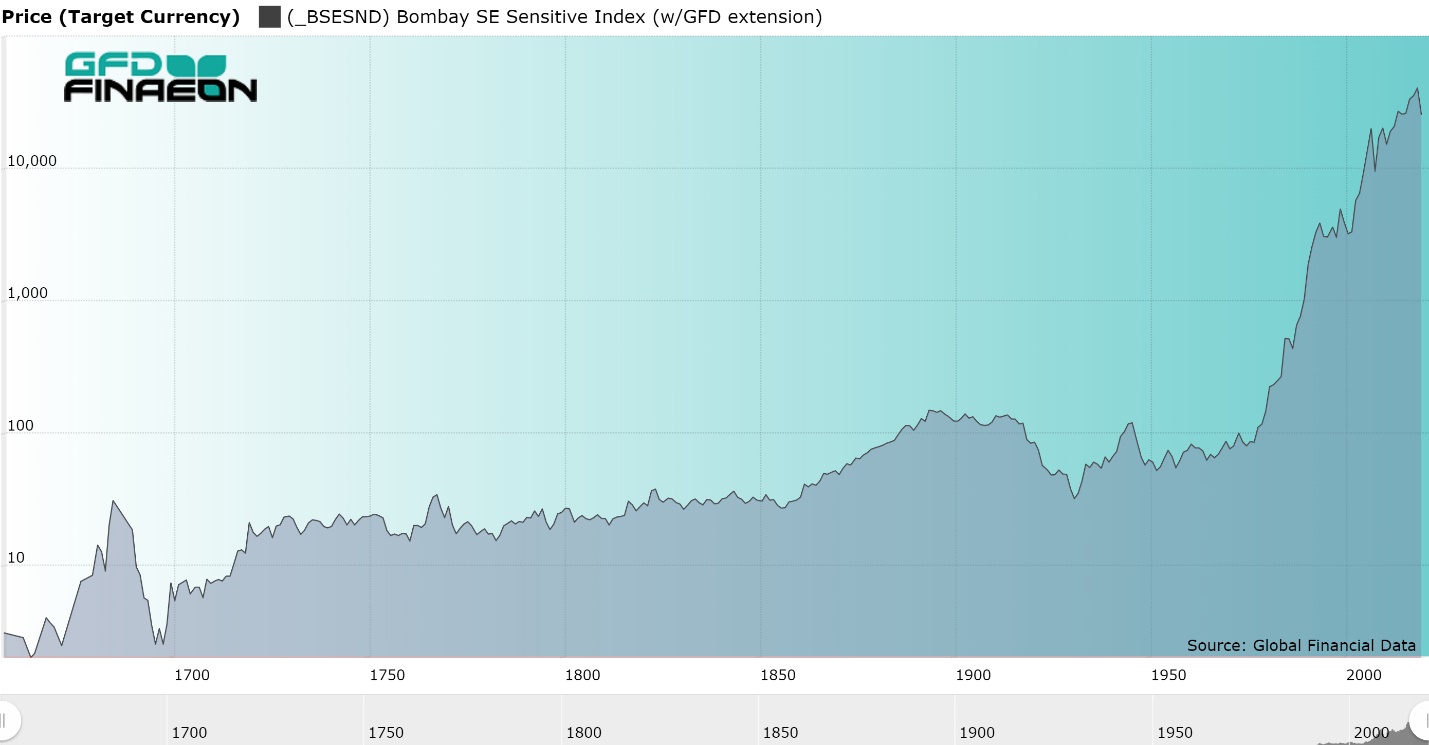
Figure 9. India Stock Market Returns, 1657 to 2019
Record Changes
Highest Monthly Average Increase – February (1.05%), May (Up 61.77% of Time)
Lowest Monthly Average Increase – July (-0.47%, Up 37.73% of Time)
Greatest Single Monthly Increase – August 1720 (89.04%)
Greatest Single Monthly Decline – September 1720 (-47.83%)
Highest Quarterly Average Increase – March-May and April-June (1.90%), February-April and March-May (Up 61.47% of Time)
Lowest Quarterly Average Increase – September (0.13%, Up 46.63% of Time)
Highest Monthly Average Increase Since 1900 – December (1.53%, Up 64.17% of Time)
Lowest Monthly Average Increase Since 1900 – August (0.00%), January-March (Up 47.93% of Time)
Greatest Single Monthly Increase Since 1900 – March 1992 (42.00%)
Greatest Single Monthly Decline Since 1900 – October 2008 (-23.89%)
Highest Quarterly Average Increase Since 1900 – October-December (2.69%), August-October (Up 65.00% of Time
Lowest Quarterly Average Increase Since 1900 – August-October (0.65%), November-January (Up 49.59% of Time)
Indonesia
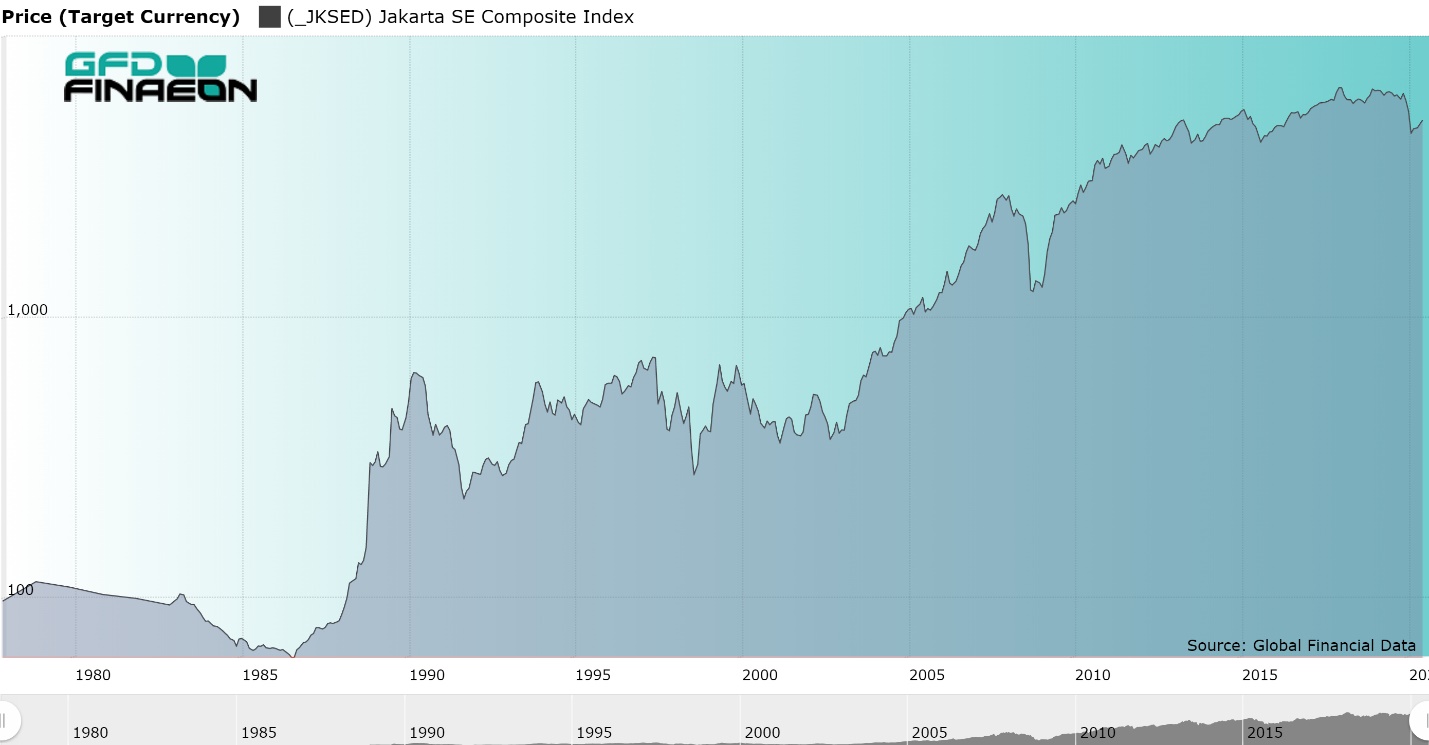
Record Changes
Highest Monthly Average Increase – December (6.06%, Up 78.38% of Time)
Lowest Monthly Average Increase – September (-1.25%), August (Up 40.54% of Time)
Greatest Single Monthly Increase – December 1988 (100.11%)
Greatest Single Monthly Decline – August 1997 (-31.51%)
Highest Quarterly Average Increase – December-February (9.41%, Up 81.08% of Time)
Lowest Quarterly Average Increase – August-October (-1.73%, Up 48.65% of Time)
Ireland
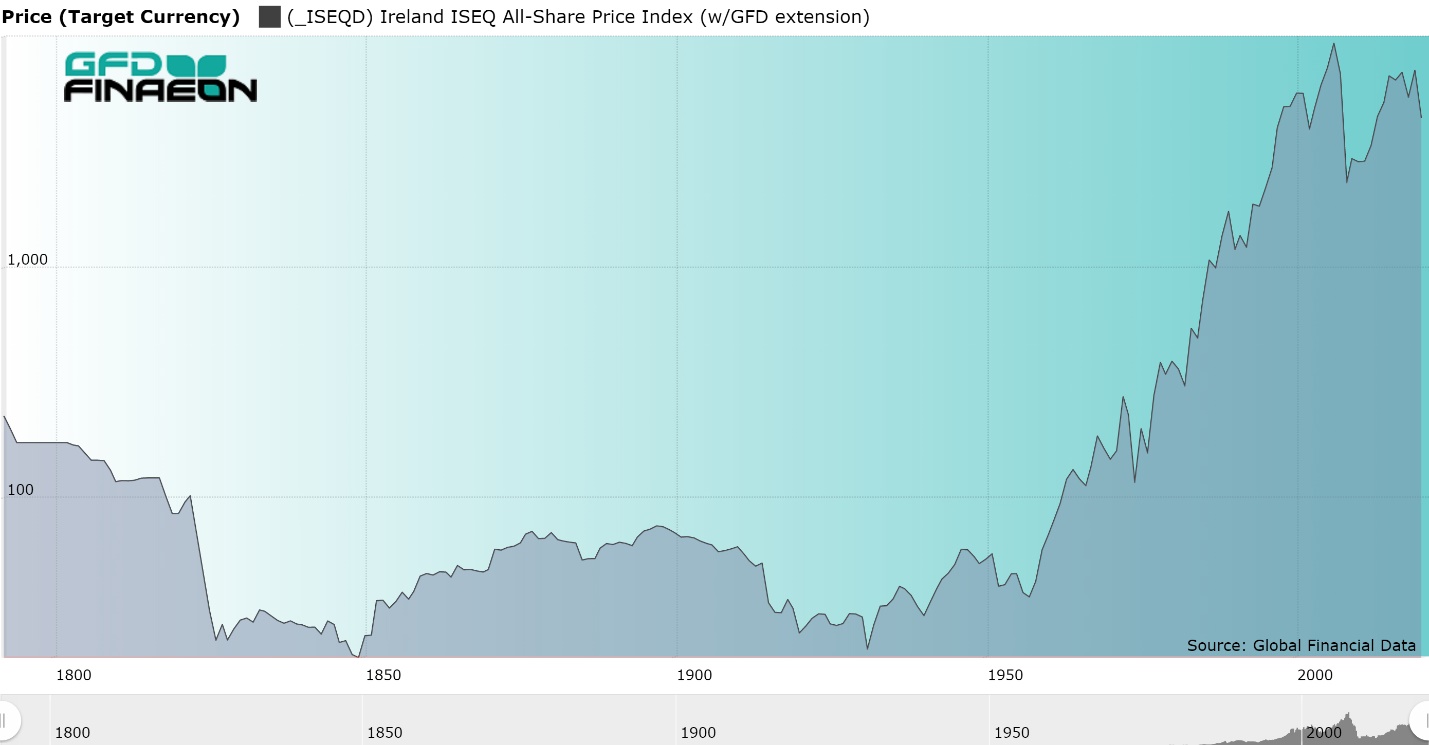
Figure 10. Ireland Stock Index, 1789 to 2019
Record Changes
Highest Monthly Average Increase – January (0.94%), May (Up 64.92% of Time)
Lowest Monthly Average Increase – October (-0.28%), August (Up 46.32% of Time)
Greatest Single Monthly Increase – June 1847 (42.14%)
Greatest Single Monthly Decline – October 1987 (-27.45%)
Highest Quarterly Average Increase – December-February (2.20%, Up 61.78% of Time)
Lowest Quarterly Average Increase – August-October (-0.70%, Up 43.16% of Time)
Highest Monthly Average Increase Since 1900 – February (1.27%), January (Up 60.33% of Time)
Lowest Monthly Average Increase Since 1900 – August (-0.25%, Up 45.83% of Time)
Greatest Single Monthly Increase Since 1900 – February 1975 (28.06%)
Greatest Single Monthly Decline Since 1900 – October 1987 (-27.45%)
Highest Quarterly Average Increase Since 1900 – January-March (3.24%), December-February (Up 67.77% of Time)
Lowest Quarterly Average Increase Since 1900 – August-October (-0.45%), June-August (Up 40.83% of Time)
Israel
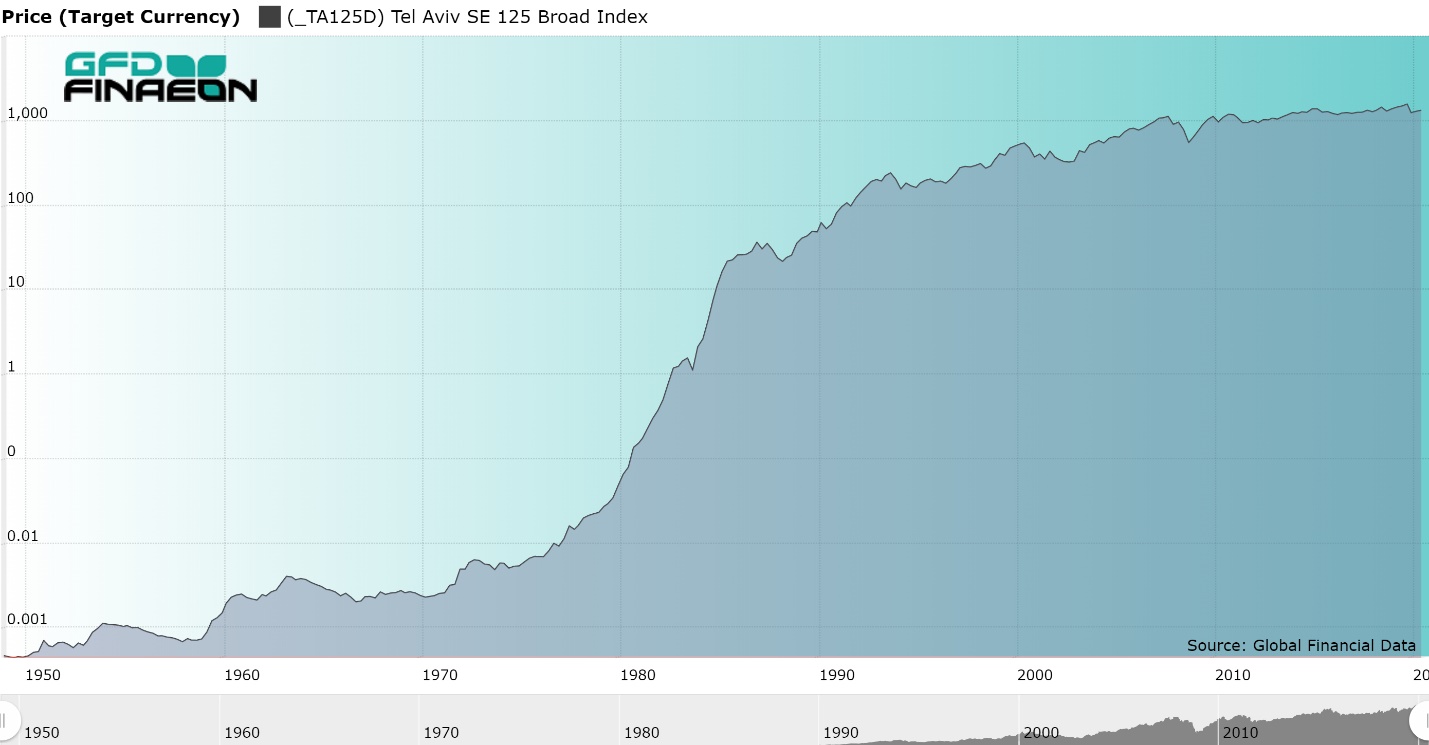
Record Changes
Highest Monthly Average Increase – April (2.91%, Up 66.67% of Time)
Lowest Monthly Average Increase – June (0.90%, Up 44.44% of Time)
Greatest Single Monthly Increase – February 1984 (40.69%)
Greatest Single Monthly Decline – December 1977 (-30.98%)
Highest Quarterly Average Increase – February-April (7.56%), December-February (Up 69.44% of Time)
Lowest Quarterly Average Increase – May-July (5.16%, Up 56.34% of Time)
Italy
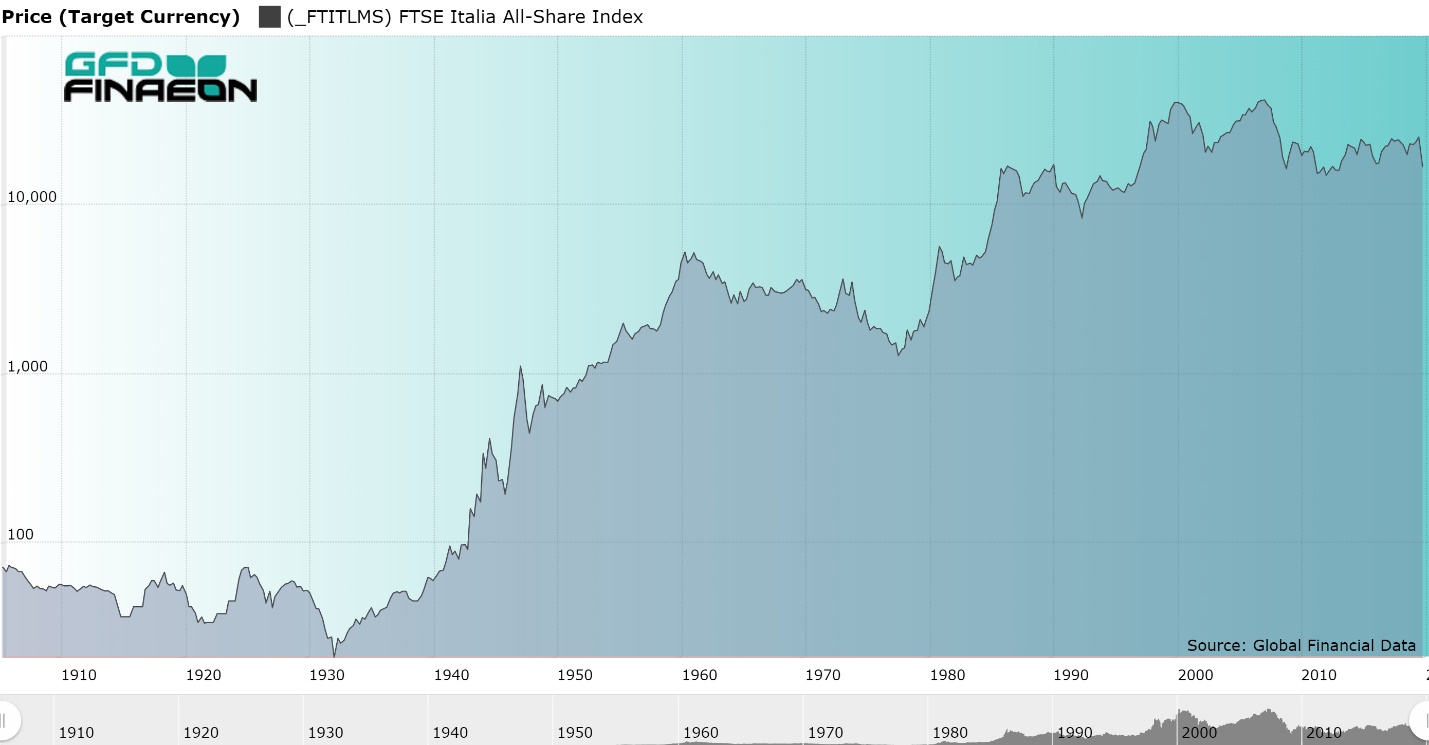
Figure 11. Italy Stock Price Index, 1905 to 2019
Record Changes
Highest Monthly Average Increase – January (2.09%), February (Up 63.72% of Time)
Lowest Monthly Average Increase – June (-1.01%, Up 44.64% of Time)
Greatest Single Monthly Increase – December 1943 (59.70%)
Greatest Single Monthly Decline – October 1947 (-26.48%)
Highest Quarterly Average Increase – December-February (5.15%, Up 67.26% of Time)
Lowest Quarterly Average Increase – September-November (-0.50%, Up 43.75% of Time)
Japan
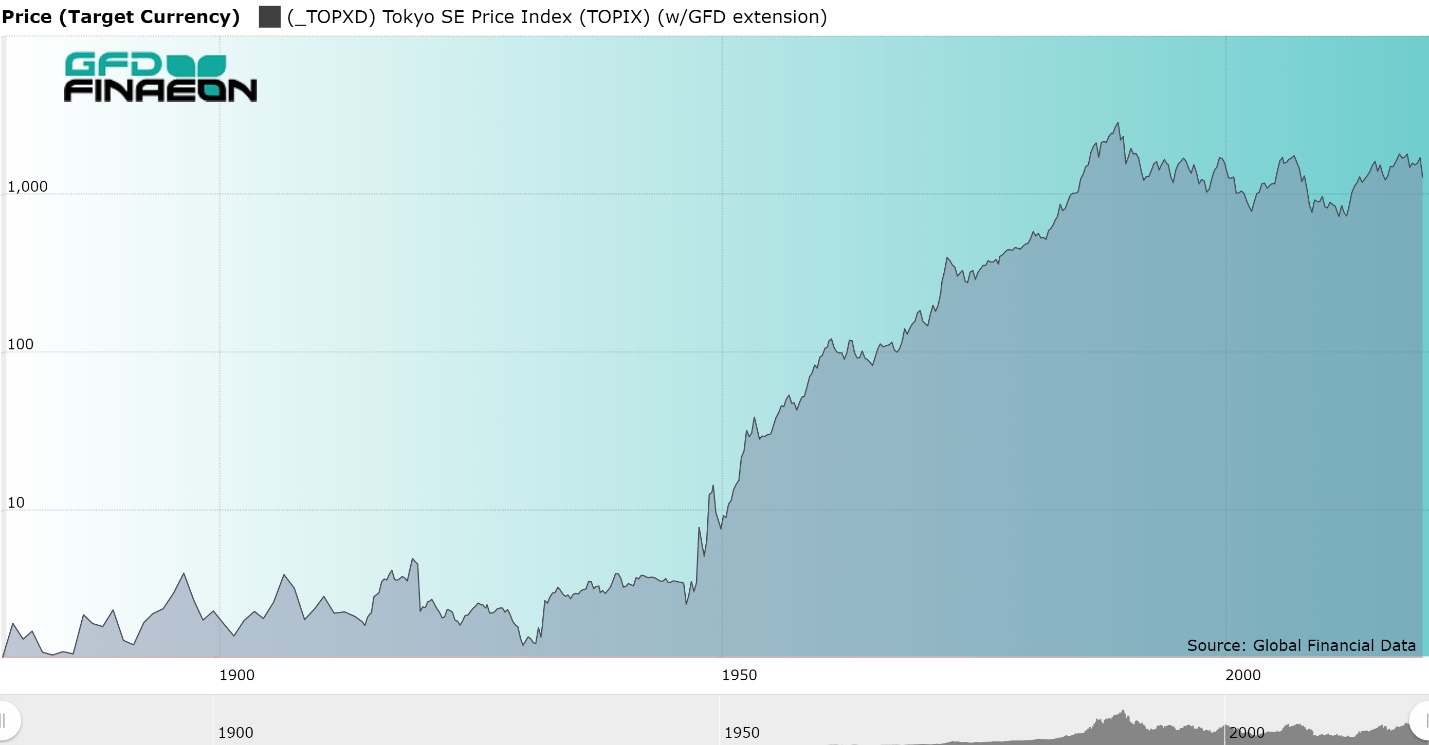
Figure 12. Japan Stock Price Index, 1879 to 2019
Record Changes
Highest Monthly Average Increase – January (3.60%, Up 70.48% of Time)
Lowest Monthly Average Increase – October (-0.64%), September (Up 47.17% of Time)
Greatest Single Monthly Increase – January 1949 (66.32%)
Greatest Single Monthly Decline – April 1920 (-26.50%)
Highest Quarterly Average Increase – December-February (7.14%, Up 71.43% of Time)
Lowest Quarterly Average Increase – August-October (-0.31%, Up 51.43% of Time)
Malaysia
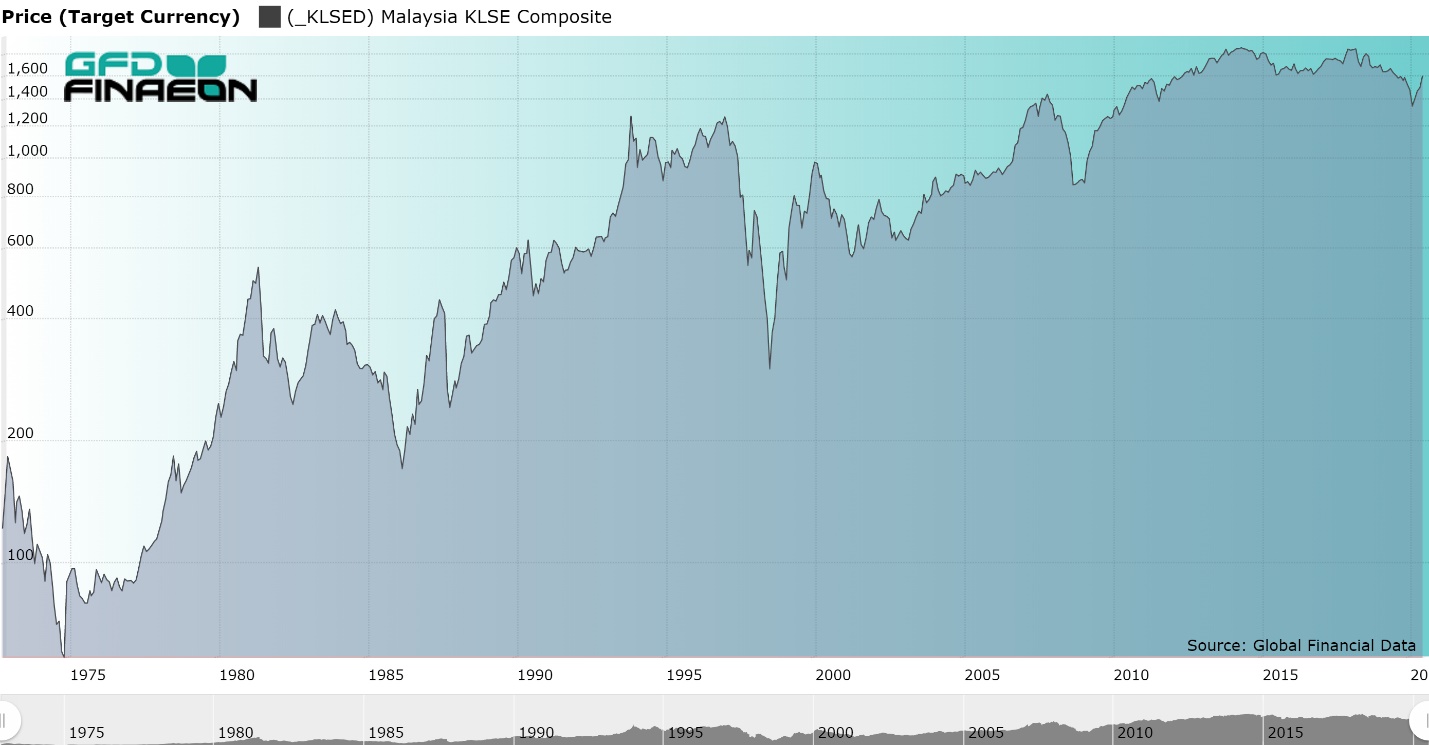
Record Changes
Highest Monthly Average Increase – December (3.44%, Up 78.72% of Time)
Lowest Monthly Average Increase – August (-2.05%, Up 38.30% of Time)
Greatest Single Monthly Increase – April 1999 (34.23%)
Greatest Single Monthly Decline – October 1987 (-34.88%)
Highest Quarterly Average Increase – December-February (9.23%, Up 79.17% of Time)
Lowest Quarterly Average Increase – July-September (-2.72%, Up 42.55% of Time)
Mexico
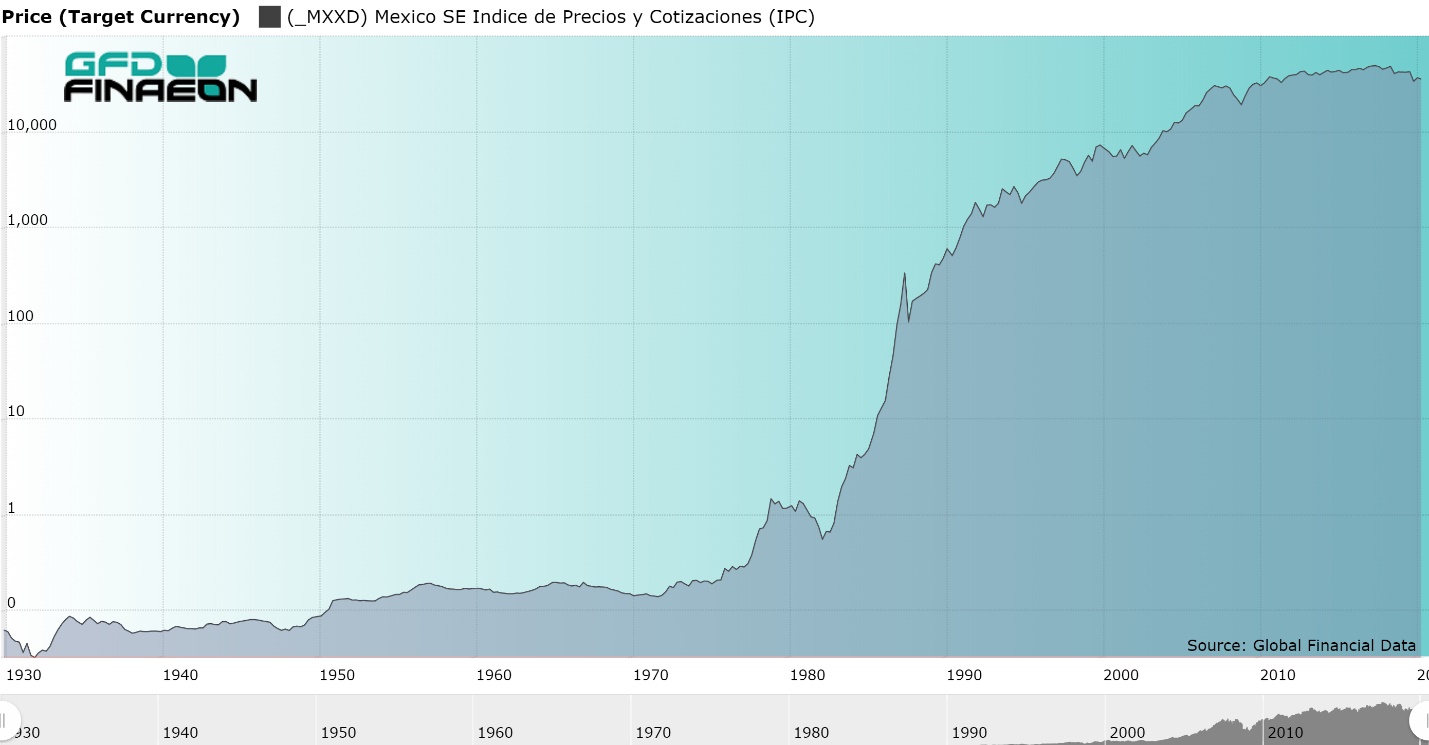
Record Changes
Highest Monthly Average Increase – January (2.75%, Up 67.03% of Time)
Lowest Monthly Average Increase – October (0.31%), May (Up 52.75% of Time)
Greatest Single Monthly Increase – February 1988 (43.67%)
Greatest Single Monthly Decline – November 1987 (-43.19%)
Highest Quarterly Average Increase – December-February (7.26%, Up 69.23% of Time)
Lowest Quarterly Average Increase – August-October (3.14%), October-December (Up 59.26% of Time)
Netherlands
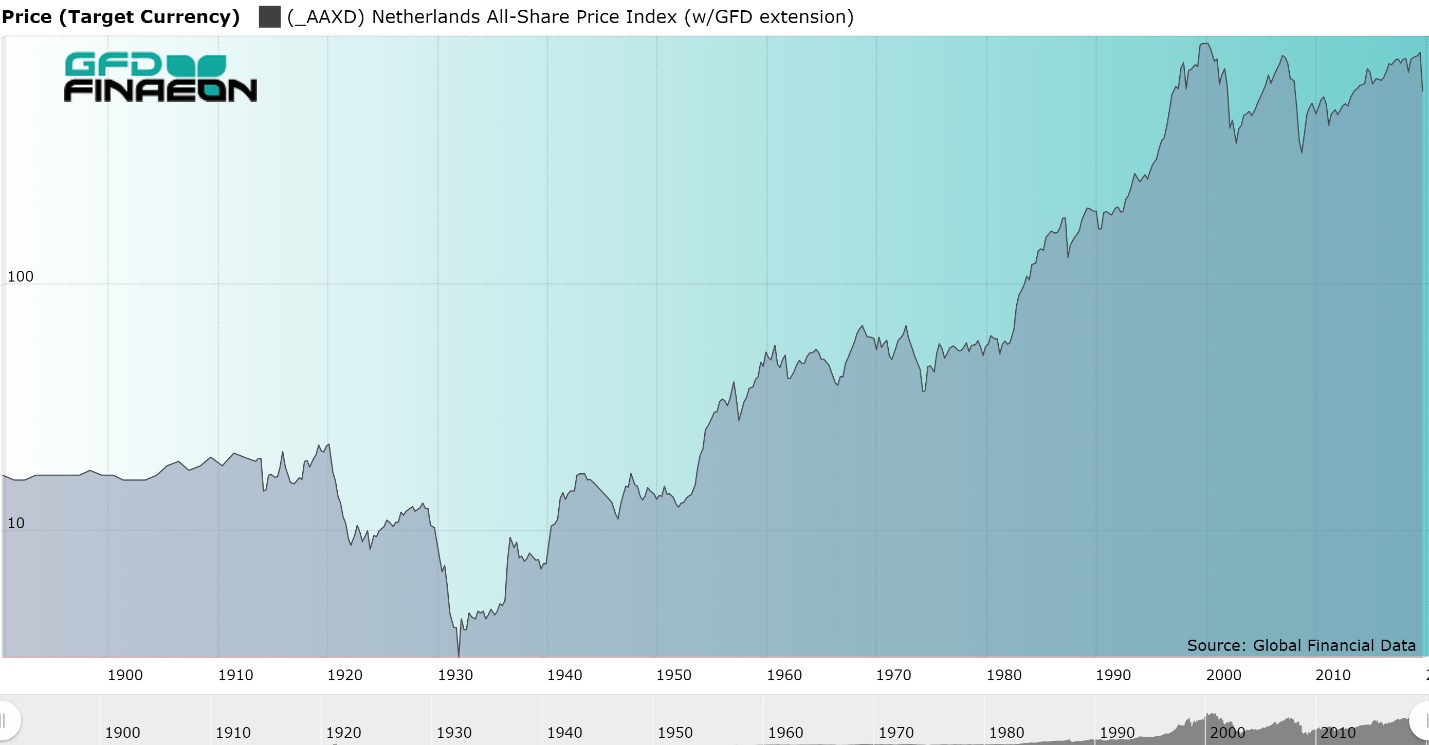
Figure 13. Netherlands All-Share Price Index, 1892 to 2019
Record Changes
Highest Monthly Average Increase – January (2.31%, Up 75.00% of Time)
Lowest Monthly Average Increase – September (-1.05%), June (Up 43.43% of Time)
Greatest Single Monthly Increase – October 1936 (25.24%)
Greatest Single Monthly Decline – October 1987 (-23.35%)
Highest Quarterly Average Increase – January-March (4.01%, Up 72.00% of Time)
Lowest Quarterly Average Increase – August-October (-0.91%, Up 50.51% of Time)
New Zealand
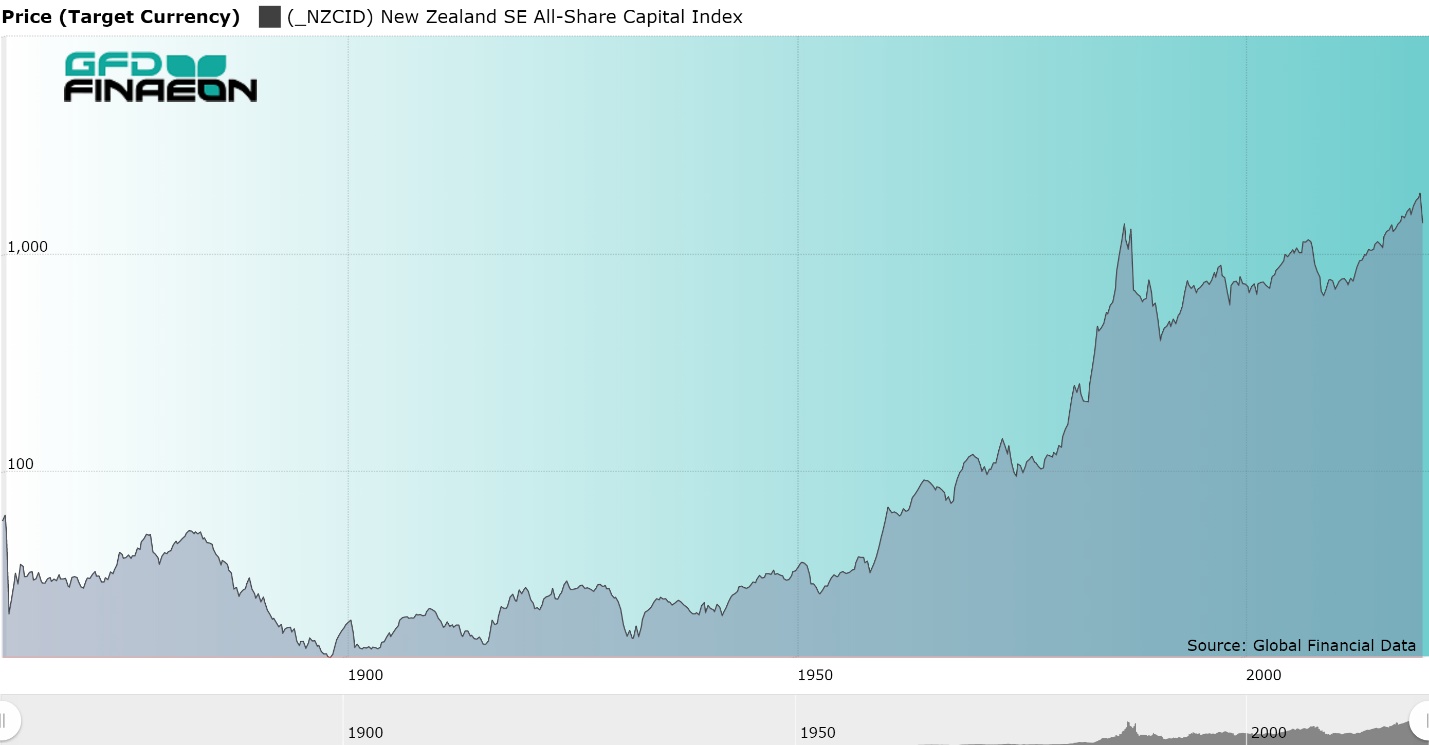
Figure 14. New Zealand Capital Price Index, 1862 to 2019
Record Changes
Highest Monthly Average Increase – April (1.18%), January (Up 67.92% of Time)
Lowest Monthly Average Increase – November (-0.37%), November and December (Up 44.94% of Time)
Greatest Single Monthly Increase – August 1989 (24.85%)
Greatest Single Monthly Decline – November 1862 (-50.00%)
Highest Quarterly Average Increase – March-May (1.46%), December-February (Up 64.15% of Time)
Lowest Quarterly Average Increase – September-November (-0.42%, Up 44.30% of Time)
Highest Monthly Average Increase Since 1900 – July (1.41%), April (Up 71.90% of Time)
Lowest Monthly Average Increase Since 1900 – September (-0.23%, Up 52.50% of Time)
Greatest Single Monthly Increase Since 1900 – August 1989 (24.85%)
Greatest Single Monthly Decline Since 1900 – October 1987 (-27.84%)
Highest Quarterly Average Increase Since 1900 – March-May (1.93%), April-June (Up 67.50% of Time)
Lowest Quarterly Average Increase Since 1900 – September-November (0.20%), October-December (Up 50.83% of Time)
Norway
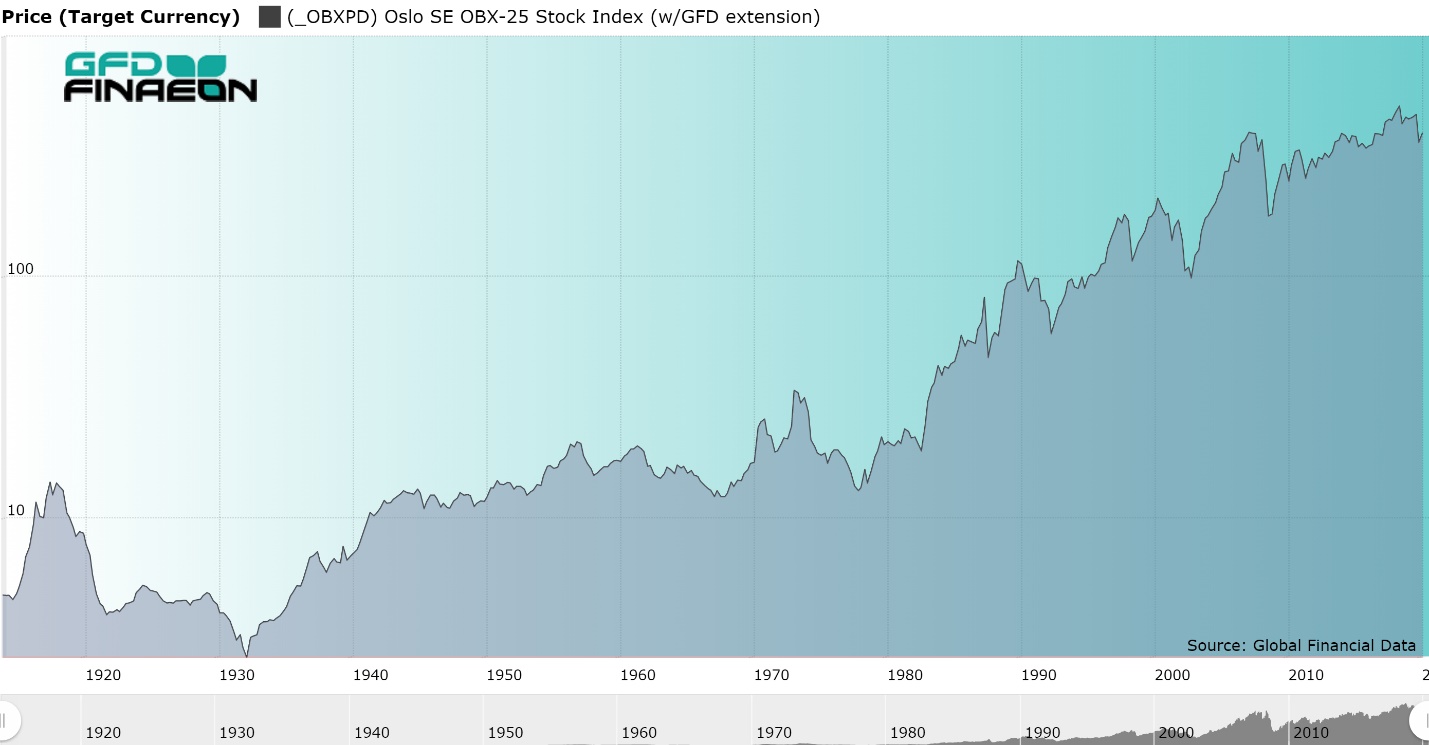
Figure 15. Norway OBX Price Index, 1914-2020
Record Changes
Highest Monthly Average Increase – January (2.00%, Up 71.03% of Time)
Lowest Monthly Average Increase – September (-0.49%), May (Up 44.86% of Time)
Greatest Single Monthly Increase – April 1983 (20.09%)
Greatest Single Monthly Decline – October 1987 (-29.85%)
Highest Quarterly Average Increase – January-March (2.73%), December-February (Up 68.22% of Time)
Lowest Quarterly Average Increase – August-November (-0.86%), April-June (Up 49.06% of Time)
Peru
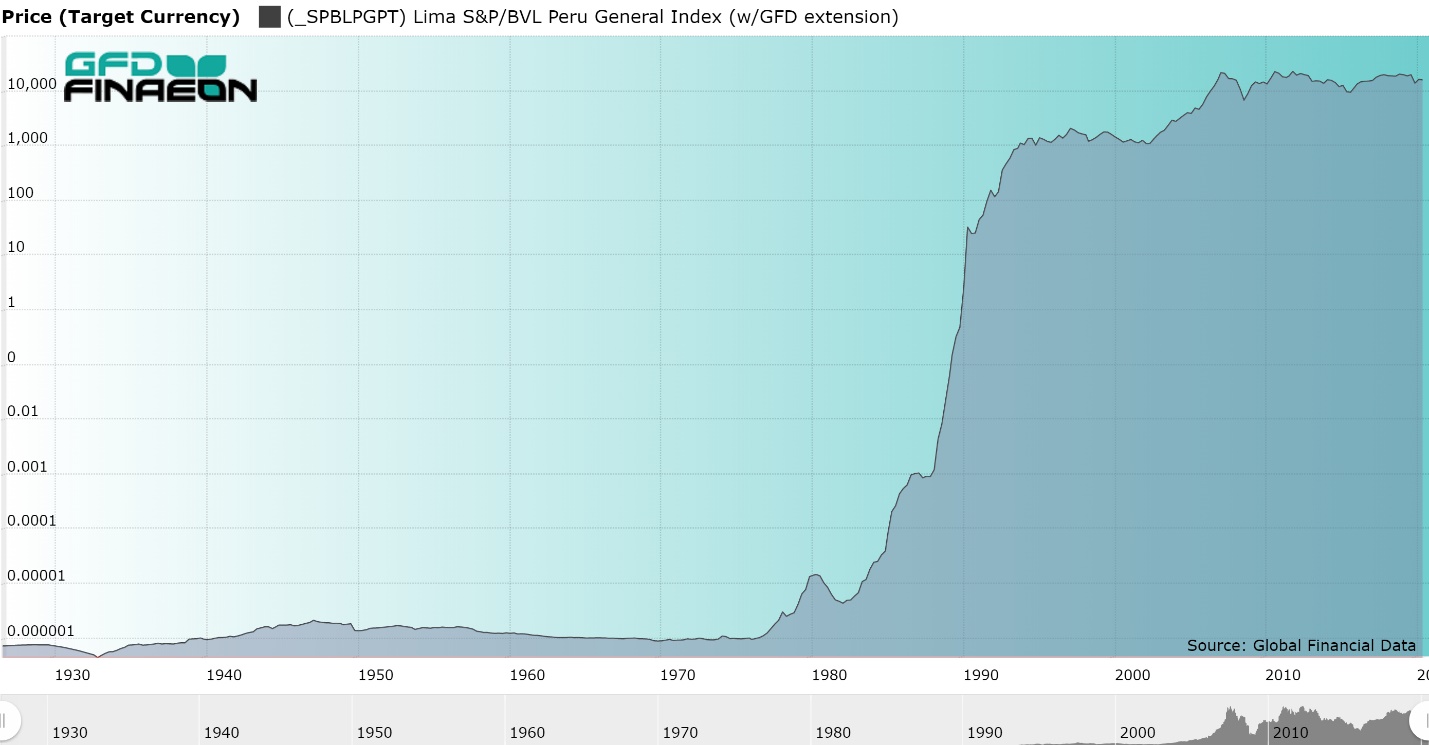
Record Changes
Highest Monthly Average Increase – September (6.04%, Up 66.67% of Time)
Lowest Monthly Average Increase – October (1.40%), January (Up 51.14% of Time)
Greatest Single Monthly Increase – September 1990 (217.12%)
Greatest Single Monthly Decline – October 2008 (-37.28%)
Highest Quarterly Average Increase – July-September (23.59%, Up 63.22% of Time)
Lowest Quarterly Average Increase – October-December (7.05%), August-October (Up 47.13% of Time)
Philippines
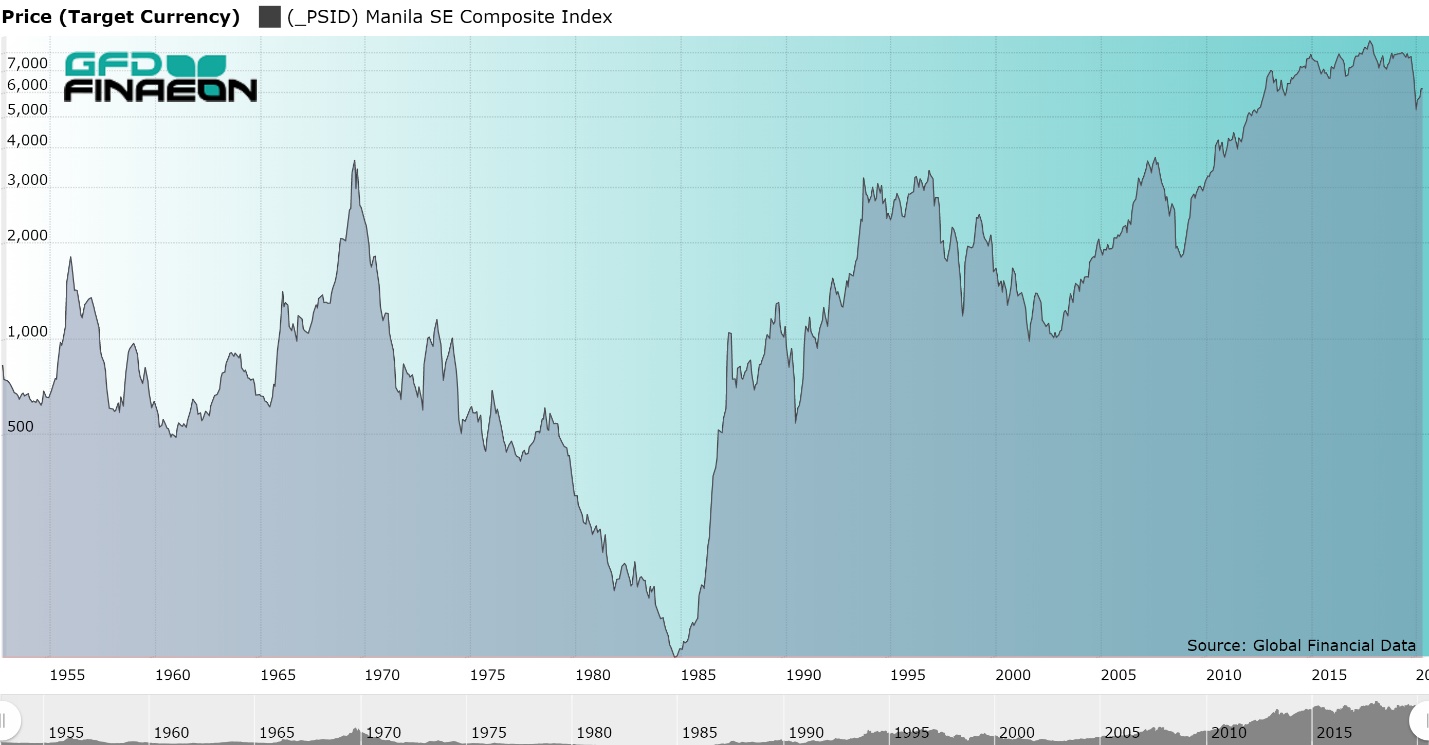
Record Changes
Highest Monthly Average Increase – January (3.71%, Up 67.65% of Time)
Lowest Monthly Average Increase – August (-1.25%, Up 38.81% of Time)
Greatest Single Monthly Increase – June 1987 (50.59%)
Greatest Single Monthly Decline – September 1987 (-28.26%)
Highest Quarterly Average Increase – January-March (6.26%), December-February (Up 63.24% of Time)
Lowest Quarterly Average Increase – July-September (-1.61%, Up 40.30% of Time)
Portugal
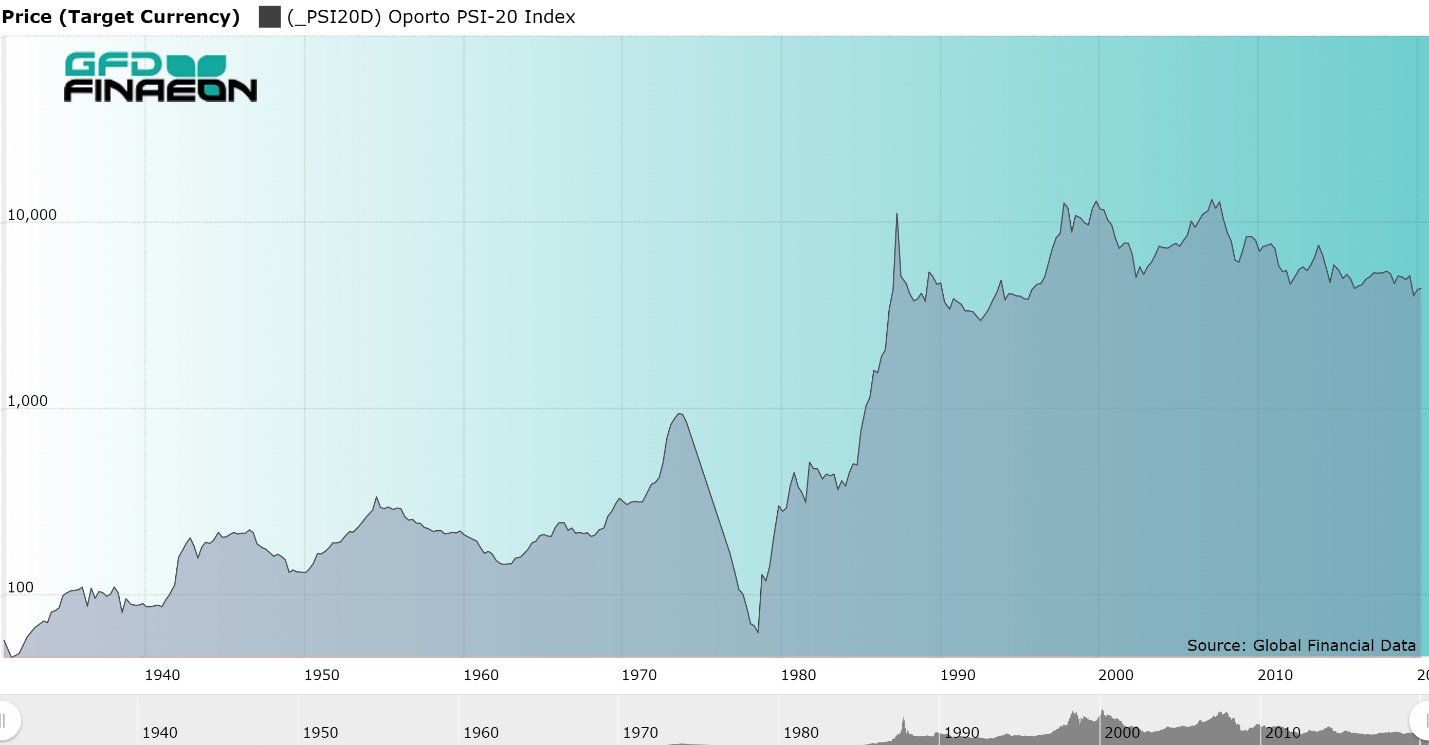
Record Changes
Highest Monthly Average Increase – January (5.75%, Up 72.62% of Time)
Lowest Monthly Average Increase – June (-1.19%, Up 34.52% of Time)
Greatest Single Monthly Increase – January 1980 (87.58%)
Greatest Single Monthly Decline – October 1987 (-25.17%)
Highest Quarterly Average Increase – January-March (7.19%, Up 65.88% of Time)
Lowest Quarterly Average Increase – May-July (-2.31%, Up 34.94% of Time)
Russia
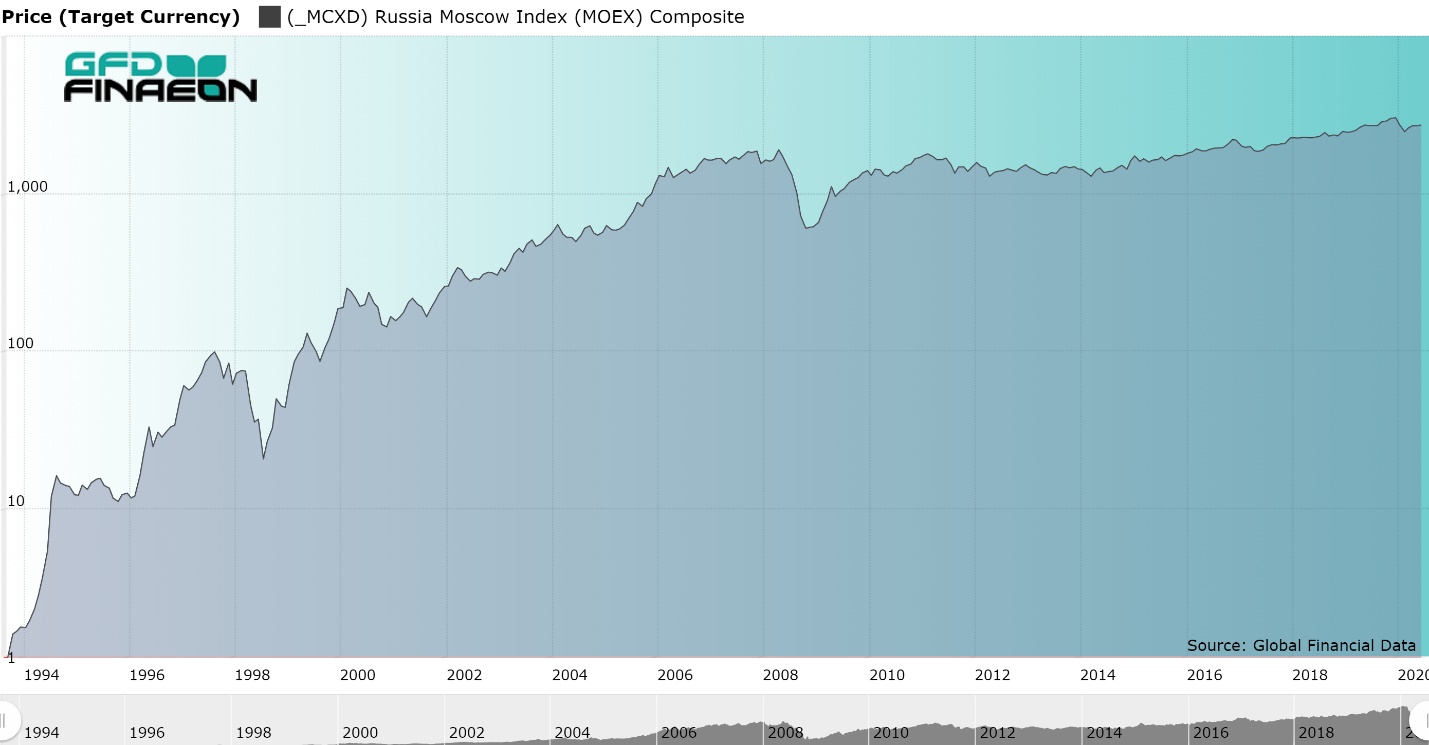
Record Changes
Highest Monthly Average Increase – August (5.39%), January (Up 70.37% of Time)
Lowest Monthly Average Increase – October (1.14%), May (Up 48.15% of Time)
Greatest Single Monthly Increase – August 1994 (122.37%)
Greatest Single Monthly Decline – August 1998 (-44.15%)
Highest Quarterly Average Increase – June-August (15.09%), December-February, February-April (Up 81.48% of Time)
Lowest Quarterly Average Increase – June-August (6.47%), May-July (Up 50.00% of Time)
Singapore
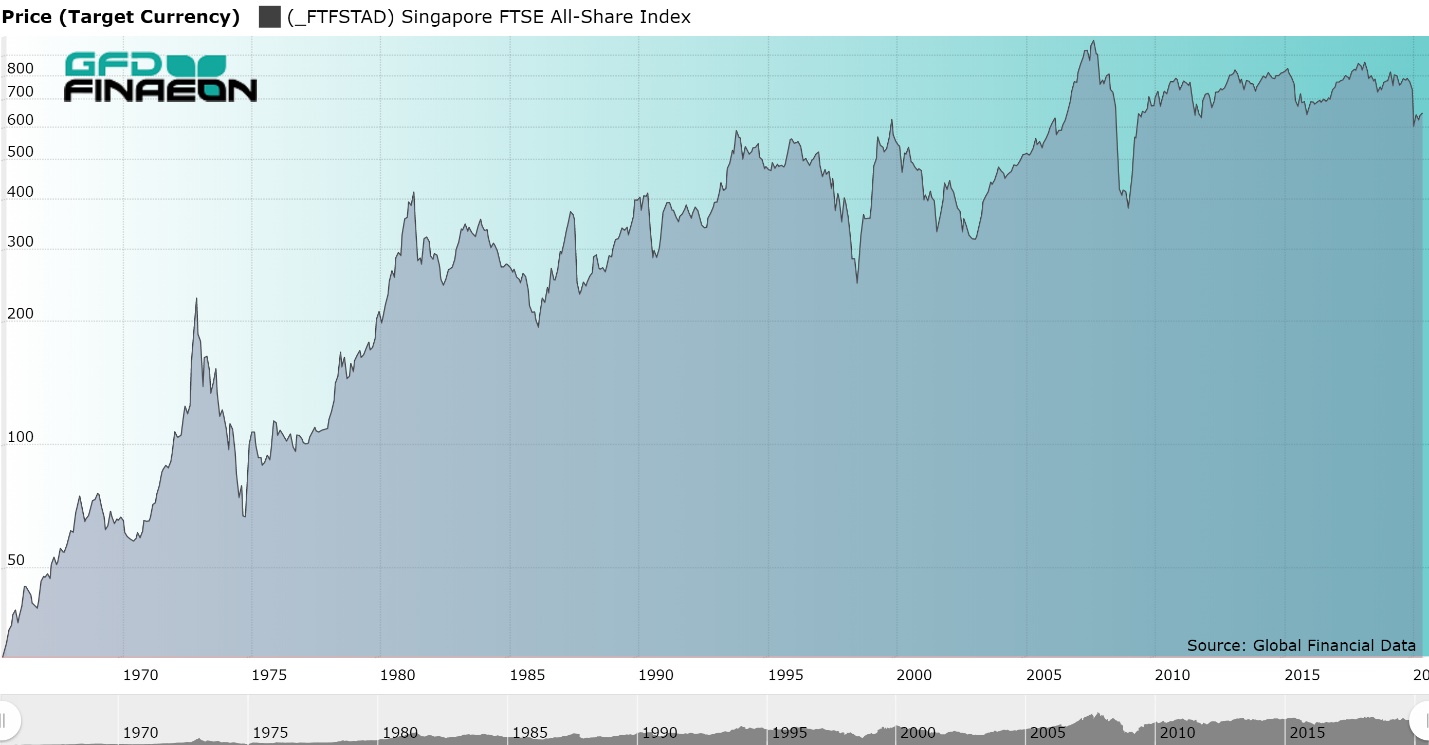
Record Changes
Highest Monthly Average Increase – January (3.25%, Up 70.91% of Time)
Lowest Monthly Average Increase – August (-1.94%, Up 34.55% of Time)
Greatest Single Monthly Increase – January 1975 (31.20%)
Greatest Single Monthly Decline – October 1987 (-29.69%)
Highest Quarterly Average Increase – December-February (6.09%, Up 72.73% of Time)
Lowest Quarterly Average Increase – July-September (-2.0%), August-October (Up 47.27% of Time)
South Africa
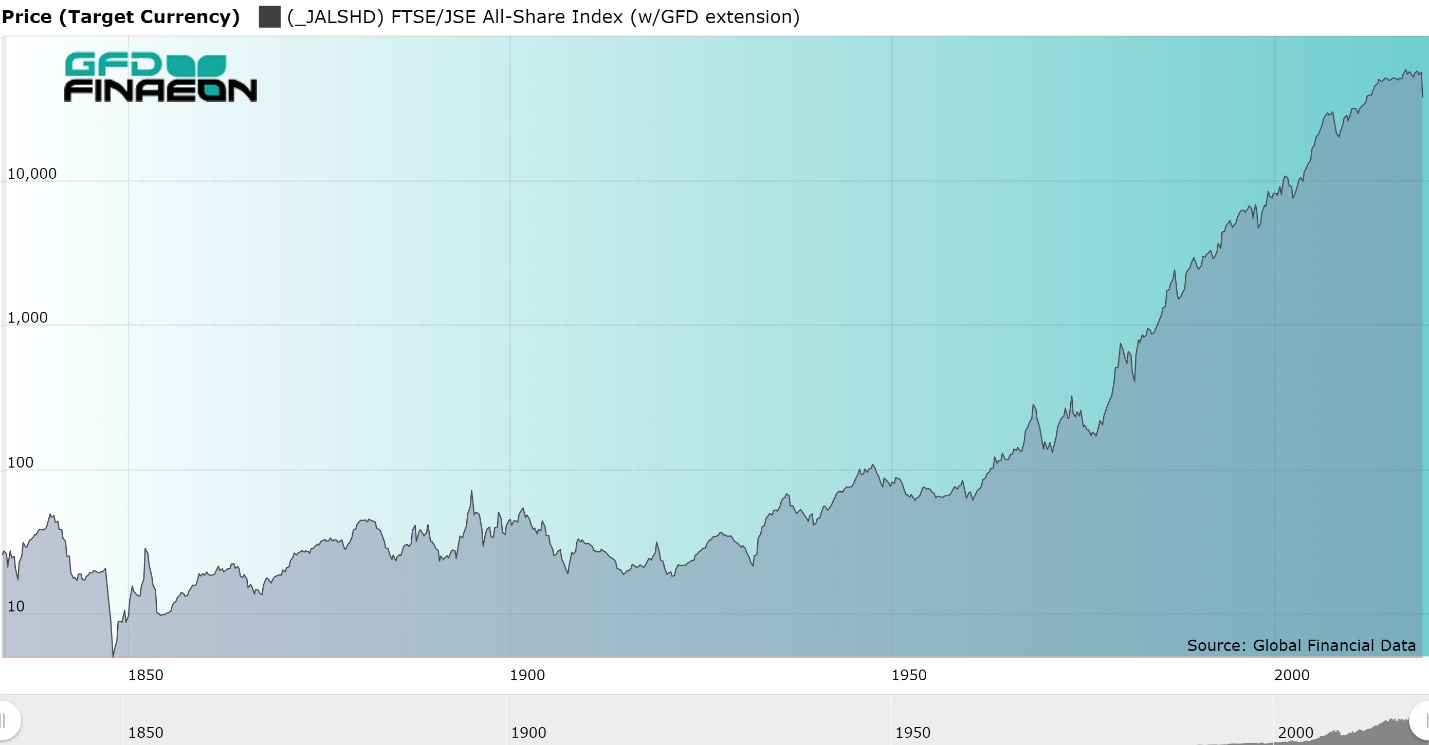
Figure 16. South African Stock Price Index, 1834 to 2019
Record Changes
Highest Monthly Average Increase – December (2.06%), August (Up 58.86% of Time)
Lowest Monthly Average Increase – June (-0.59%), October (Up 42.41% of Time)
Greatest Single Monthly Increase – May 1897 (27.86%)
Greatest Single Monthly Decline – August 1998 (-29.63%)
Highest Quarterly Average Increase – October-December (3.10%), November-January (Up 62.89% of Time)
Lowest Quarterly Average Increase – May-July (-1.13%, Up 49.37% of Time)
Highest Monthly Average Increase Since 1900 – December (1.74%), August (Up 70.83% of Time)
Lowest Monthly Average Increase Since 1900 – June (-0.73%, Up 41.67% of Time)
Greatest Single Monthly Increase Since 1900 – December 1973 (17.85%)
Greatest Single Monthly Decline Since 1900 – August 1998 (-29.63%)
Highest Quarterly Average Increase Since 1900 – December-February (3.01%, Up 64.46% of Time)
Lowest Quarterly Average Increase Since 1900 – May-July (0.67%, Up 50.83%)
South Korea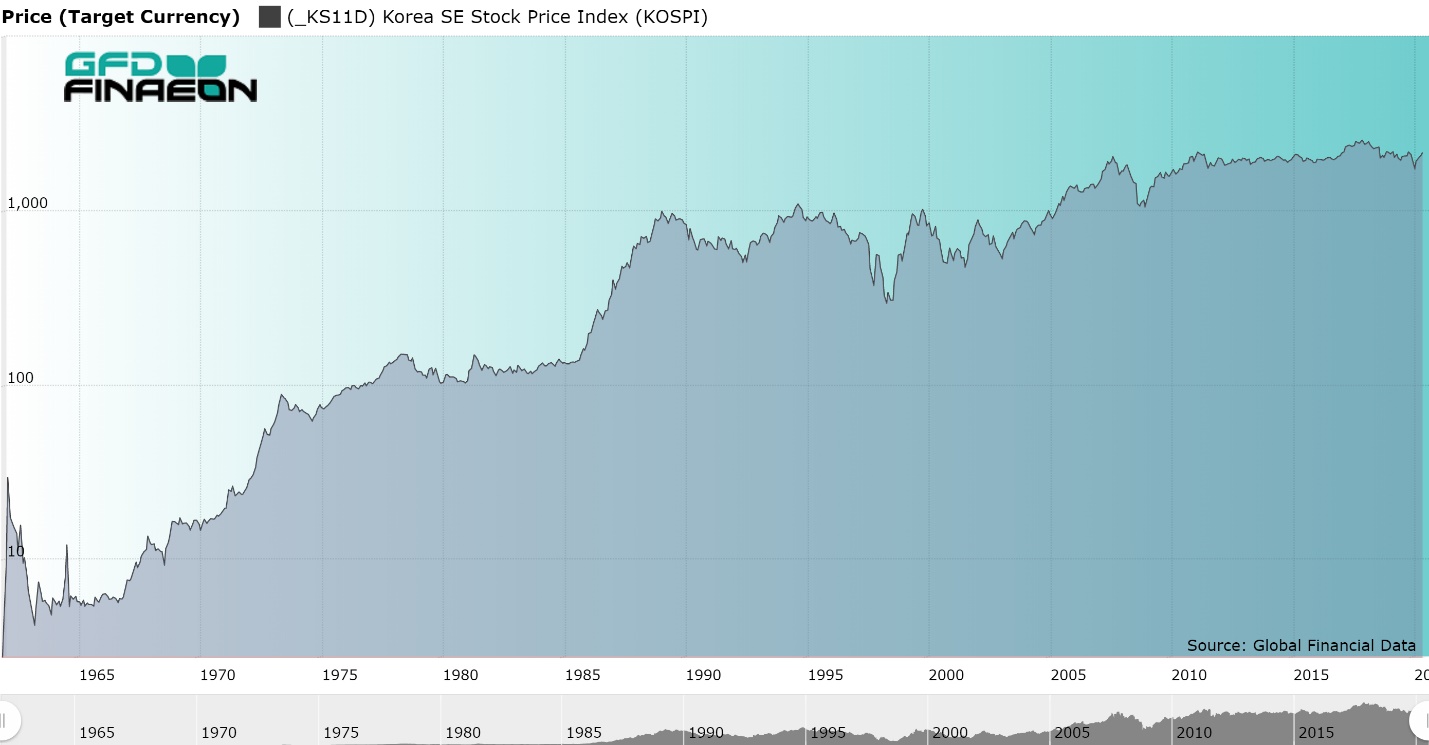
Record Changes
Highest Monthly Average Increase – April (4.15%), July (Up 67.24% of Time)
Lowest Monthly Average Increase – August (-0.65%, Up 39.66% of Time)
Greatest Single Monthly Increase – April 1962 (209.34%)
Greatest Single Monthly Decline – October 1964 (-55.73%)
Highest Quarterly Average Increase – February-April (19.08%, Up 67.80% of Time)
Lowest Quarterly Average Increase – August-October (-0.99%, Up 50.00% of Time)
Spain
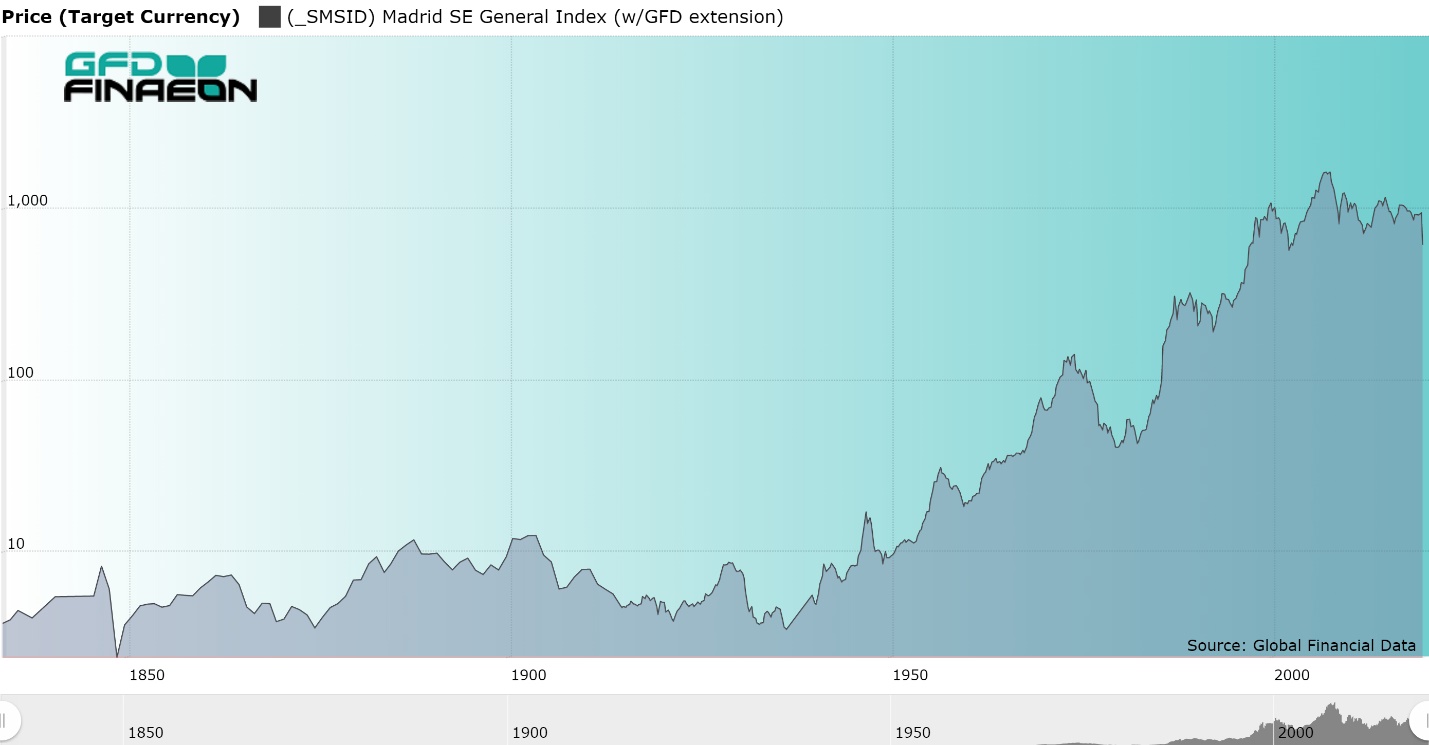
Figure 17. Spain Stock Price Index, 1833 to 2019
Record Changes
Highest Monthly Average Increase – January (2.31%, Up 71.72% of Time)
Lowest Monthly Average Increase – May (-0.48%), June (Up 43.43% of Time)
Greatest Single Monthly Increase – March 1986 (23.51%)
Greatest Single Monthly Decline – October 1987 (-28.45%)
Highest Quarterly Average Increase – December-February (4.66%, Up 74.75% of Time)
Lowest Quarterly Average Increase – August-November (-0.36%), May-July (Up 41.41% of Time)
Sweden
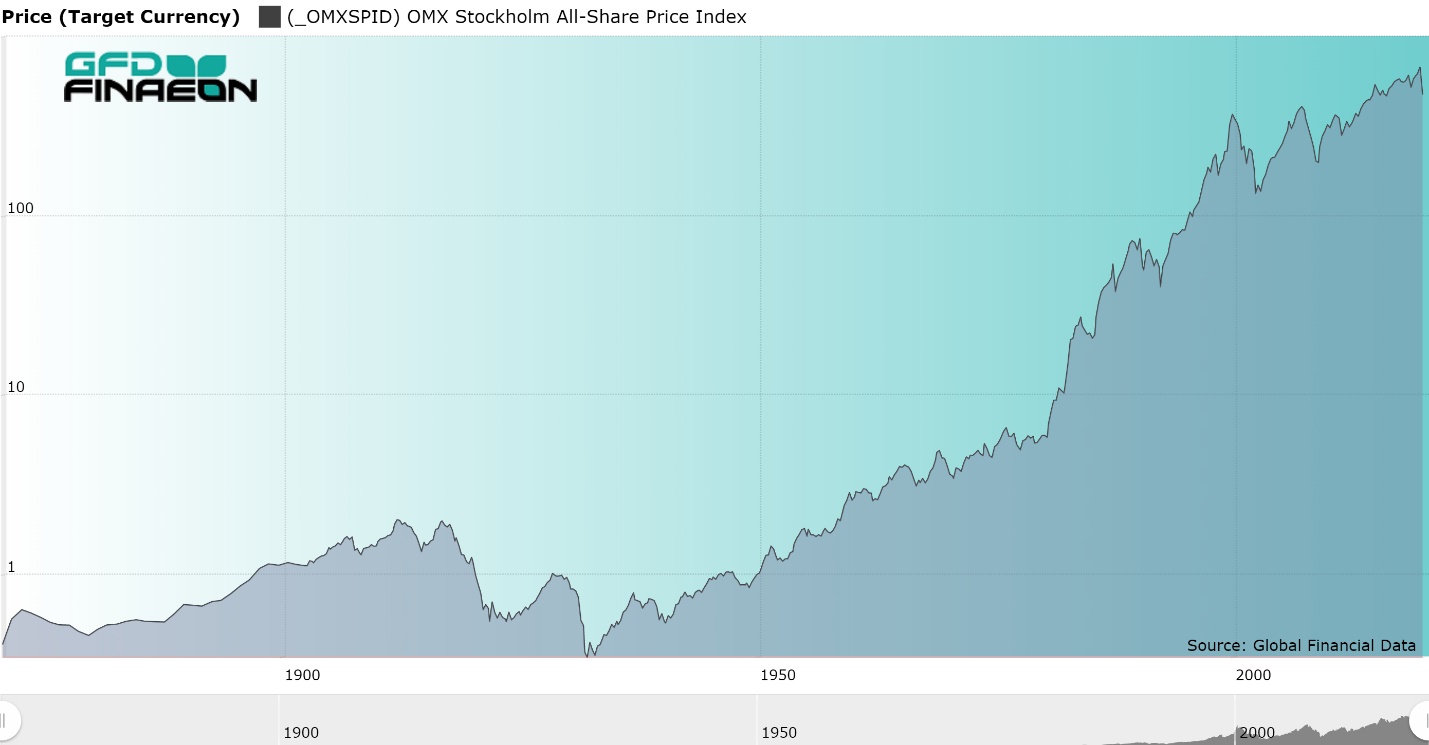
Figure 18. Sweden All-Share Stock Price Index, 1870 to 2019
Record Changes
Highest Monthly Average Increase – January (2.64%, Up 77.31% of Time)
Lowest Monthly Average Increase – September (-1.02%, Up 36.44% of Time)
Greatest Single Monthly Increase – November 1992 (27.14%)
Greatest Single Monthly Decline – March 1932 (-27.64%)
Highest Quarterly Average Increase – December-February (4.93, Up 76.47% of Time)
Lowest Quarterly Average Increase – August-October (-1.20%), April-June (Up 49.15% of Time)
Switzerland
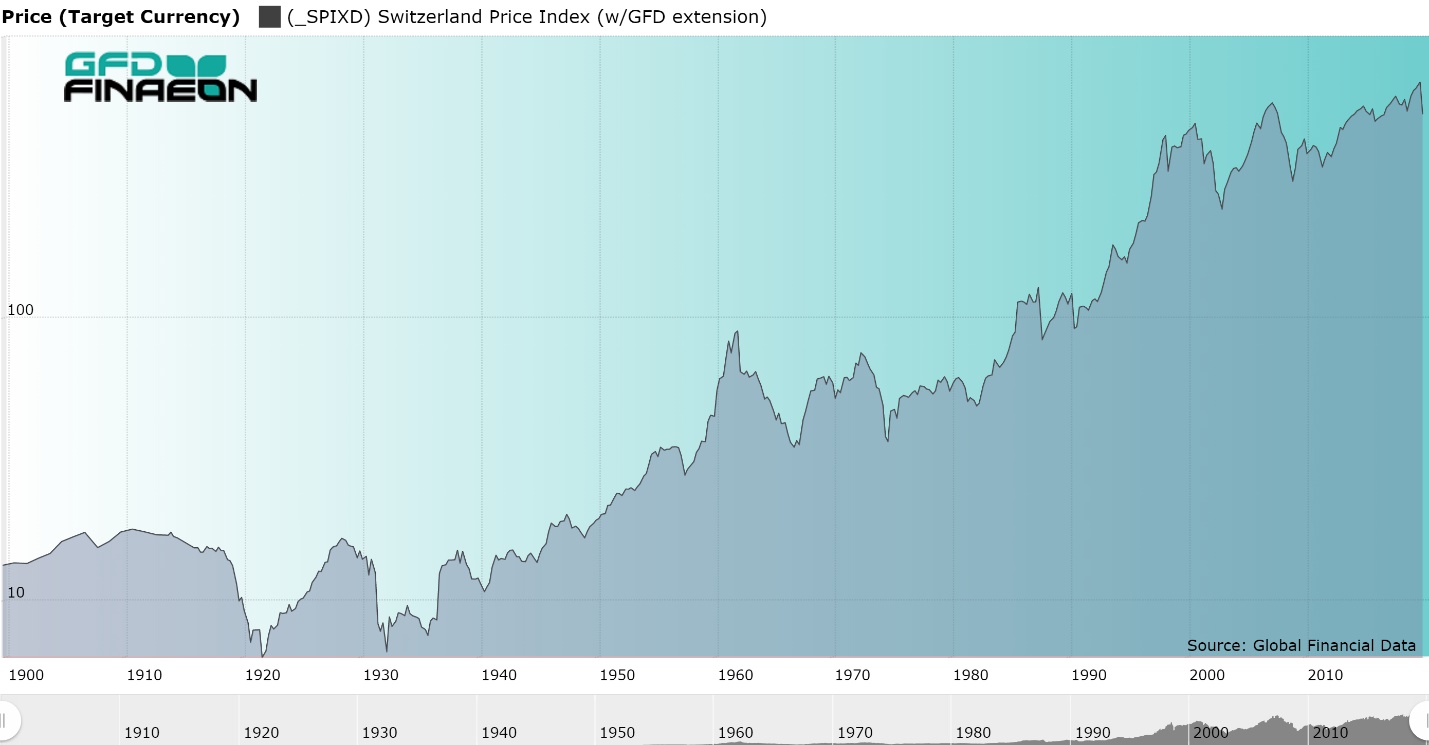
Figure 19. Switzerland Stock Price Index, 1900 to 2019
Record Changes
Highest Monthly Average Increase – January (2.20%, Up 74.00% of Time)
Lowest Monthly Average Increase – September (-0.86%, Up 50.51% of Time)
Greatest Single Monthly Increase – October 1936 (33.35%)
Greatest Single Monthly Decline – October 1987 (-24.85%)
Highest Quarterly Average Increase – November-January (3.96%, Up 77.00% of Time)
Lowest Quarterly Average Increase – September-November (-0.09%, Up 49.49% of Time)
Taiwan
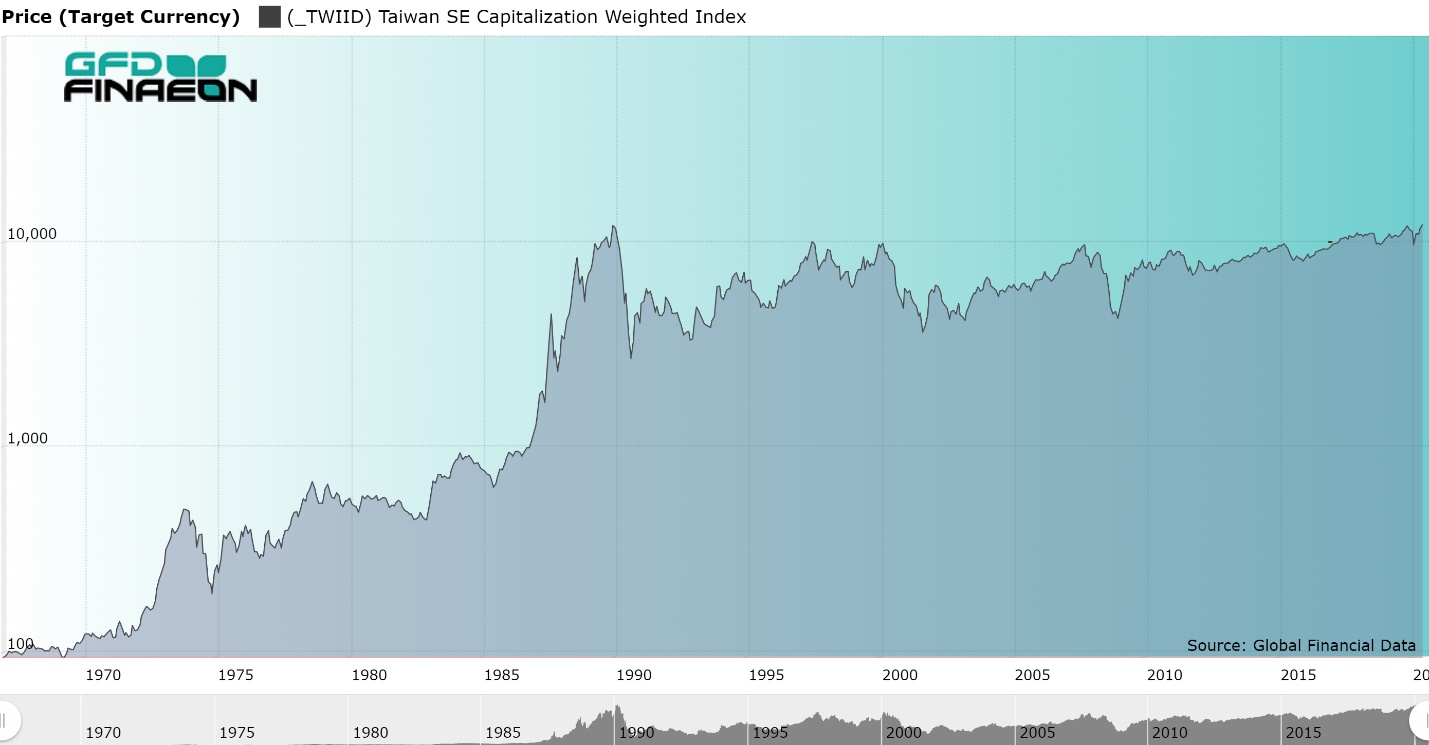
Record Changes
Highest Monthly Average Increase – January (3.41%), December (Up 73.58% of Time)
Lowest Monthly Average Increase – October (-1.28%), July (Up 43.40% of Time)
Greatest Single Monthly Increase – August 1987 (50.14%)
Greatest Single Monthly Decline – October 1987 (-38.95%)
Highest Quarterly Average Increase – December-February (8.80%, Up 81.48% of Time)
Lowest Quarterly Average Increase – August-October (-1.81%), July-September (Up 43.40% of Time)
Thailand
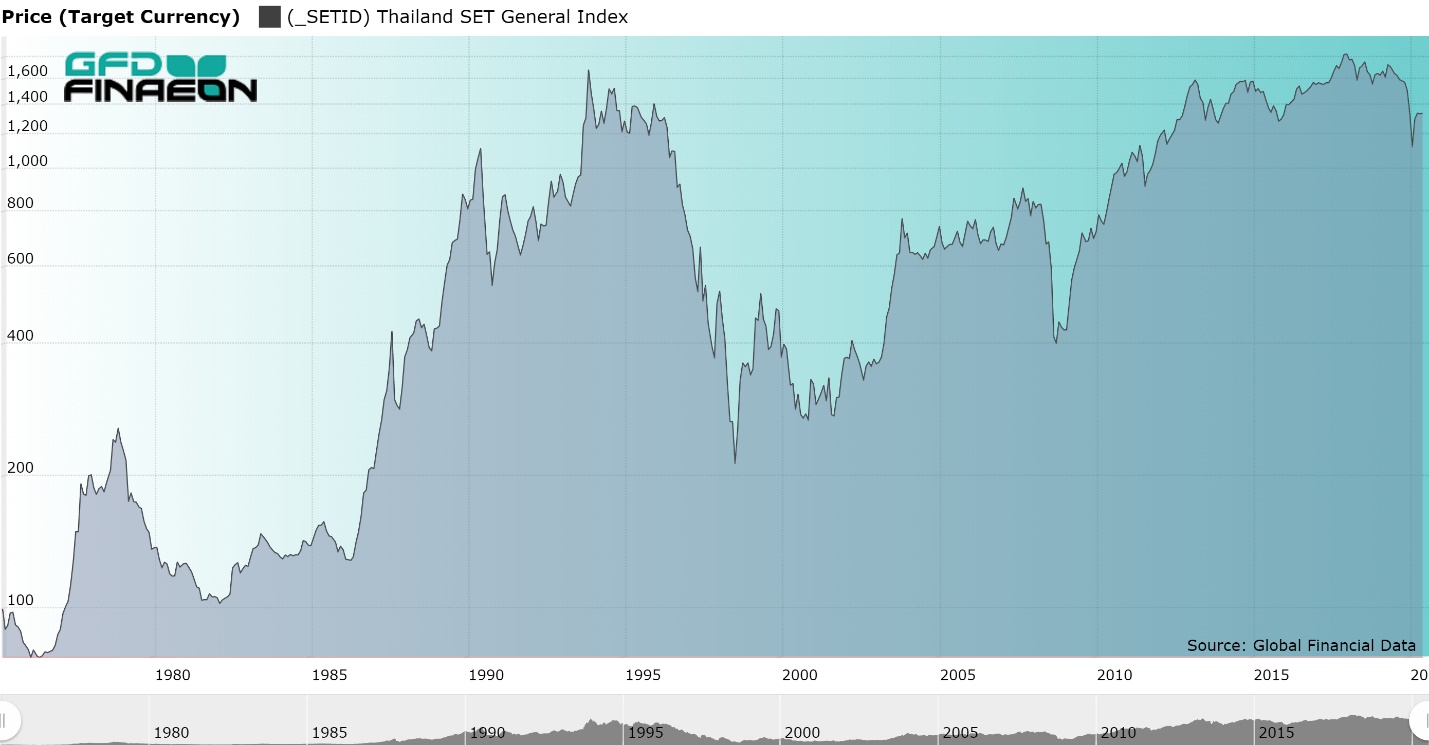
Record Changes
Highest Monthly Average Increase – December (6.06%, Up 78.38% of Time)
Lowest Monthly Average Increase – September (-1.25%), August, November (Up 40.54% of Time)
Greatest Single Monthly Increase – December 1988 (100.11%)
Greatest Single Monthly Decline – August 1997 (-31.51%)
Highest Quarterly Average Increase – December-February (9.41%, Up 81.08% of Time)
Lowest Quarterly Average Increase – August-October (-1.73%, Up 48.65% of Time)
Turkey
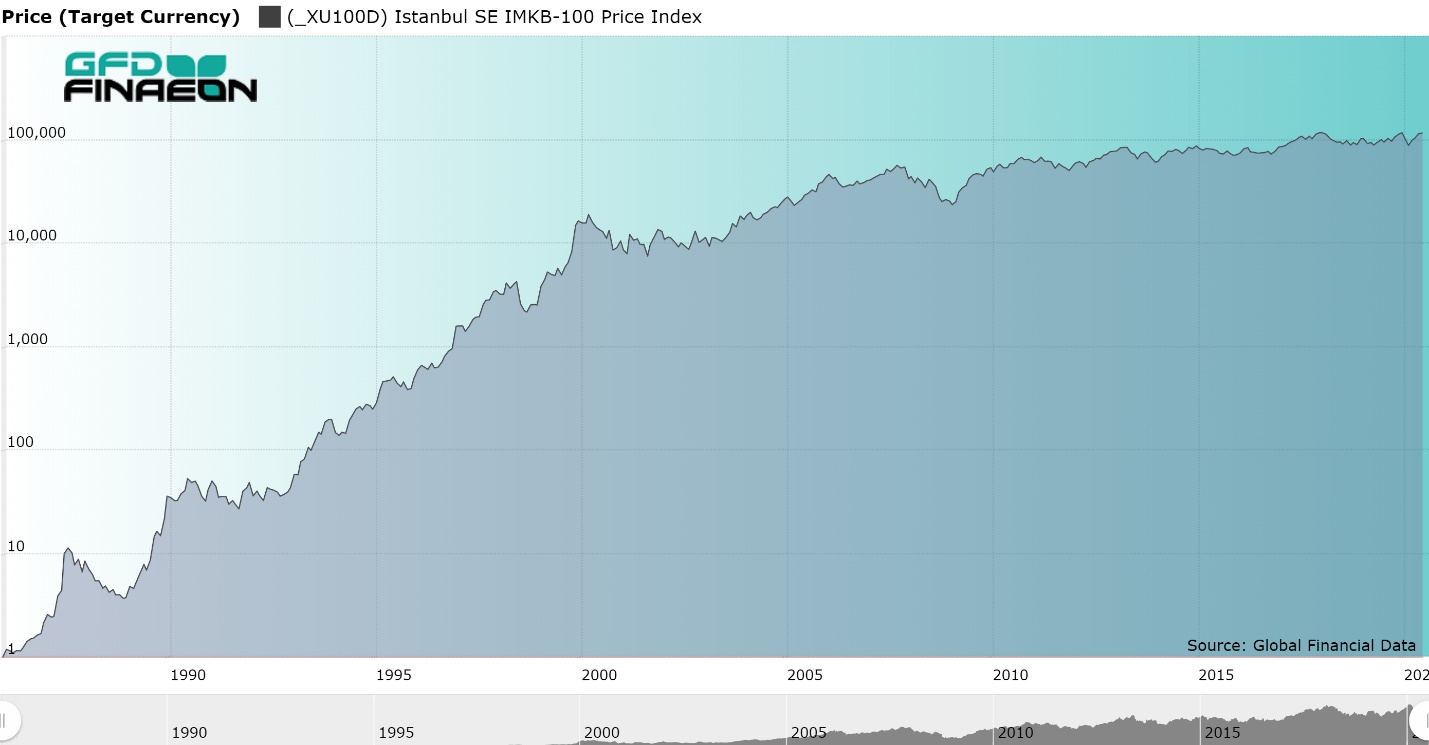
Record Changes
Highest Monthly Average Increase – January (9.12%, Up 74.29% of Time)
Lowest Monthly Average Increase – August (-0.32%), May (Up 40.00% of Time)
Greatest Single Monthly Increase – July 1987 (126.91%)
Greatest Single Monthly Decline – August 1998 (39.03%)
Highest Quarterly Average Increase – November-January (20.23%, Up 77.14% of Time)
Lowest Quarterly Average Increase – March-May (6.45%, Up 51.43% of Time)
United Kingdom
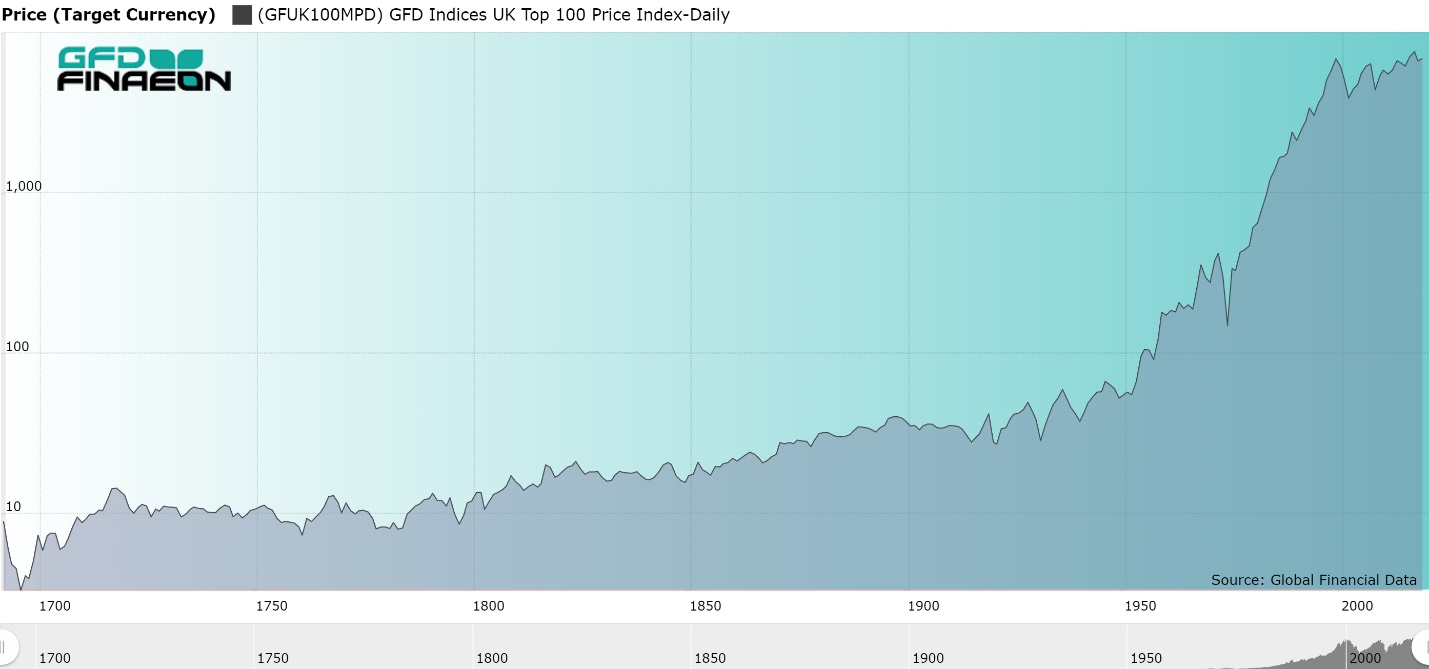
Figure 20. GFD UK-100 Price Index, 1692 to 2018
Record Changes
Highest Monthly Average Increase – December (0.85%, Up 66.16% of Time)
Lowest Monthly Average Increase – September (-0.46%), October (Up 42.99% of Time)
Greatest Single Monthly Increase – June 1720 (63.94%)
Greatest Single Monthly Decline – September 1720 (-53.98%)
Highest Quarterly Average Increase – November-January (1.63%, Up 68.69% of Time)
Lowest Quarterly Average Increase – September-November (-0.49%), August-October (Up 47.26% of Time)
Highest Monthly Average Increase Since 1900 – April (1.92%, Up 73.55% of Time)
Lowest Monthly Average Increase Since 1900 – September (-0.56%), June (Up 43.33% of Time)
Greatest Single Monthly Increase Since 1900 – January 1975 (49.40%)
Greatest Single Monthly Decline Since 1900 – October 1987 (-26.04%)
Highest Quarterly Average Increase Since 1900 – November-January (2.79%, Up 76.03% of Time)
Lowest Quarterly Average Increase Since 1900 – May-July (-0.48%, Up 46.67% of Time)
United States
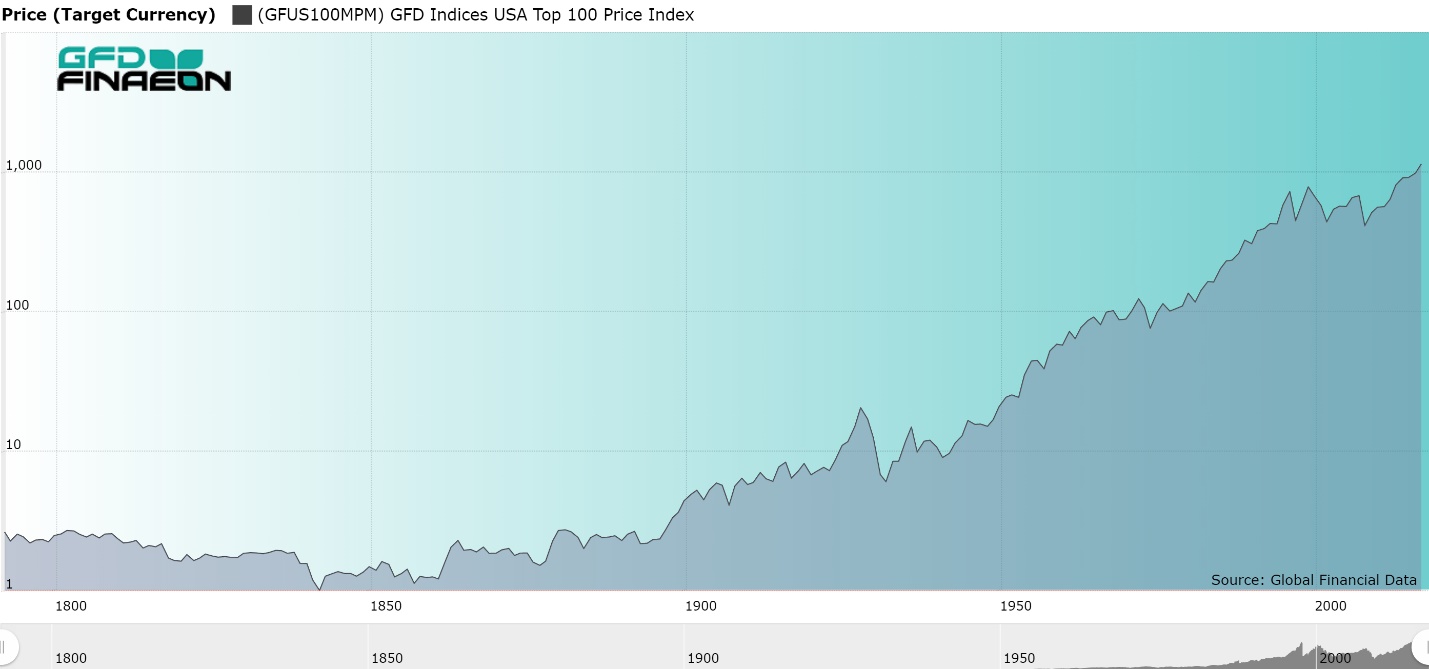
Figure 21. GFD US-100 Price Index, 1792 to 2019
Record Changes
Highest Monthly Average Increase – April (0.79%, Up 60.70% of Time),
Lowest Monthly Average Increase – September (-0.27%), January (Up 51.97% of Time)
Greatest Single Monthly Increase – April 1933 (34.71%)
Greatest Single Monthly Decline – September 1931 (-28.04%)
Highest Quarterly Average Increase – November-January (1.61%), October-December (Up 65.79% of Time)
Lowest Quarterly Average Increase – August-October (0.46%), January-March (Up 52.40% of Time)
Highest Monthly Average Increase Since 1900 – April (1.34%), December (Up 71.67% of Time)
Lowest Monthly Average Increase Since 1900 – September (-0.52, Up 50.00% of Time)
Greatest Single Monthly Increase Since 1900 – April 1933 (34.71%)
Greatest Single Monthly Decline Since 1900 – September 1931 (-28.04%)
Highest Quarterly Average Increase Since 1900 – November-January (2.99%), October-December (Up 74.17% of Time)
Lowest Quarterly Average Increase Since 1900 – August-October (0.75%), January-March (Up 53.72% of Time)
World
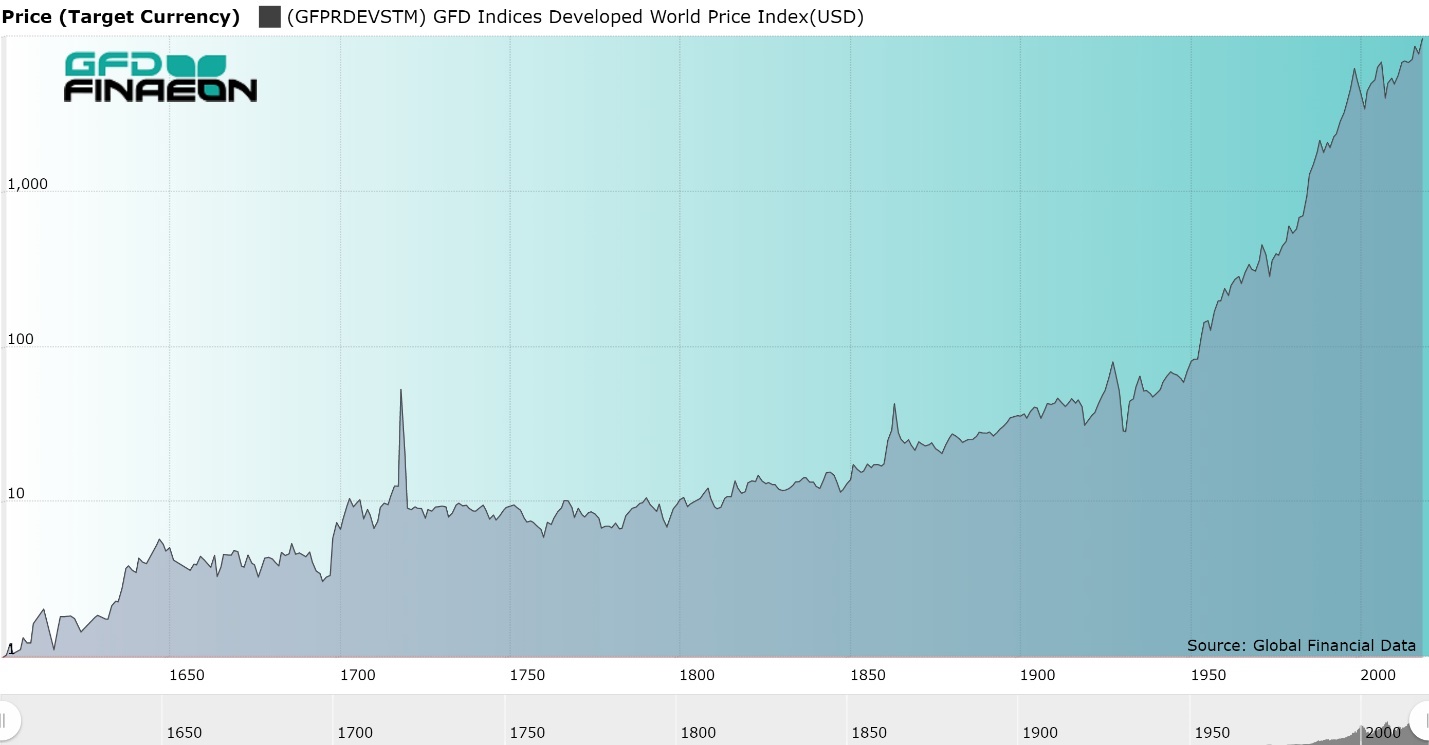
Figure 22. GFD Developed World Price Index in USD, 1602 to 2019
Highest Monthly Average Increase – December (0.74%, Up 63.41% of Time)
Lowest Monthly Average Increase – September (-0.45%), October (Up 40.67% of Time)
Greatest Single Monthly Increase – August 1719 (81.74%)
Greatest Single Monthly Decline – September 1721 (-55.75%)
Highest Quarterly Average Increase – June-August (1.64%), November-January (Up 61.59% of Time)
Lowest Quarterly Average Increase – September-November (-0.40%, Up 49.54% of Time)
Highest Monthly Average Increase Since 1900 – April (1.38%), December (Up 73.33% of Time)
Lowest Monthly Average Increase Since 1900 – September (-0.57%), June (Up 48.33% of Time)
Greatest Single Monthly Increase Since 1900 – April 1933 (21.60%)
Greatest Single Monthly Decline Since 1900 – September 1931 (-23.49%)
Highest Quarterly Average Increase Since 1900 – November-January (2.67%, Up 71.90% of Time)
Lowest Quarterly Average Increase Since 1900 – August-October (0.24%), May-July (Up 54.17% of Time)
World x/USA
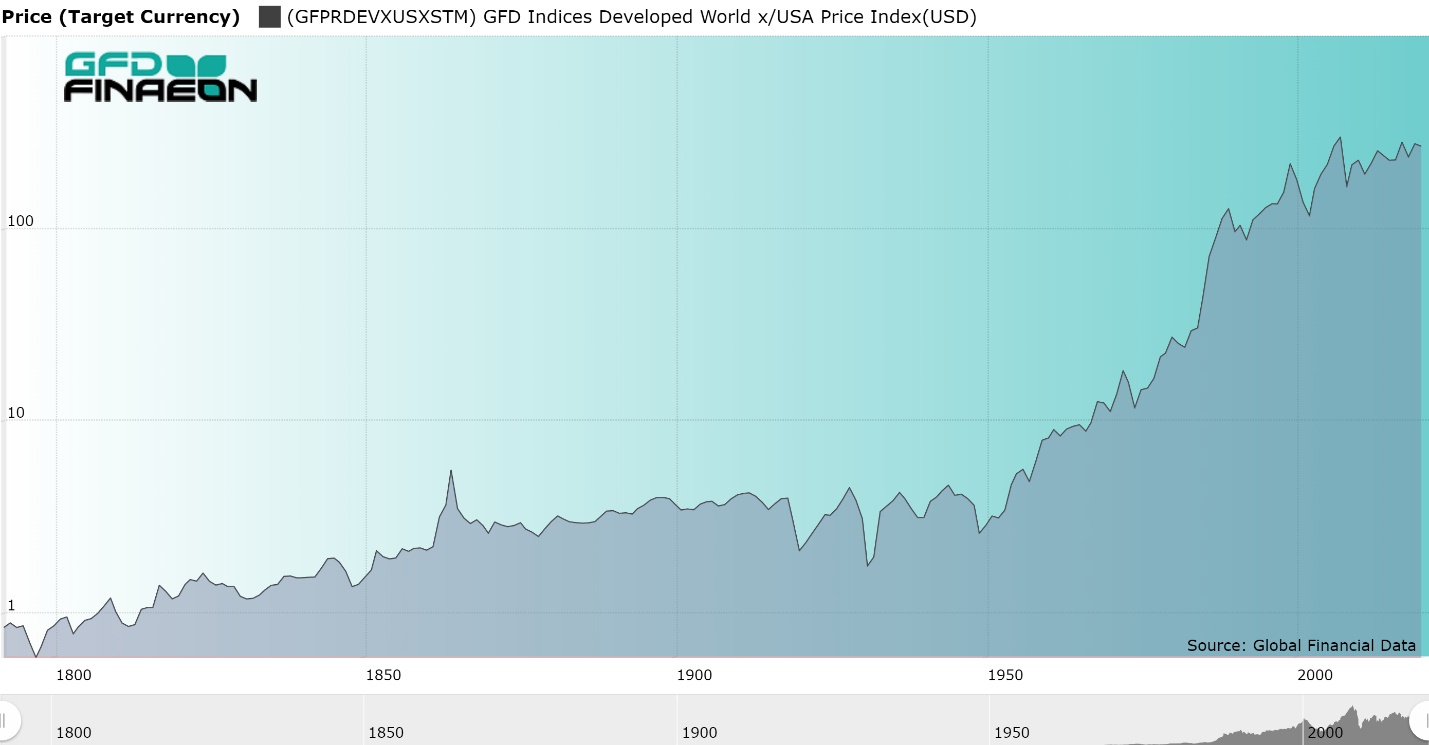
Figure 23. Developed World Index Excluding the United States, 1792 to 2019
Highest Monthly Average Increase – December (0.97%), April (Up 64.63% of Time)
Lowest Monthly Average Increase – September (-0.37%), October (Up 49.56% of Time)
Greatest Single Monthly Increase – January 1975 (15.83%)
Greatest Single Monthly Decline – September 1949 (-24.68%)
Highest Quarterly Average Increase – December-February (1.94%, Up 65.50% of Time)
Lowest Quarterly Average Increase – August-October (-0.25%, Up 50.00% of Time)
Highest Monthly Average Increase Since 1900 – April (1.57%, Up 72.27% of Time)
Lowest Monthly Average Increase Since 1900 – September (-0.68%), June (Up 44.07% of Time)
Greatest Single Monthly Increase Since 1900 – January 1975 (15.83%)
Greatest Single Monthly Decline Since 1900 – September 1949 (-24.68%)
Highest Quarterly Average Increase Since 1900 – December-February (2.89%, Up 70.59% of Time)
Lowest Quarterly Average Increase Since 1900 – May-July (-0.26%, Up 42.37% of Time)
Europe
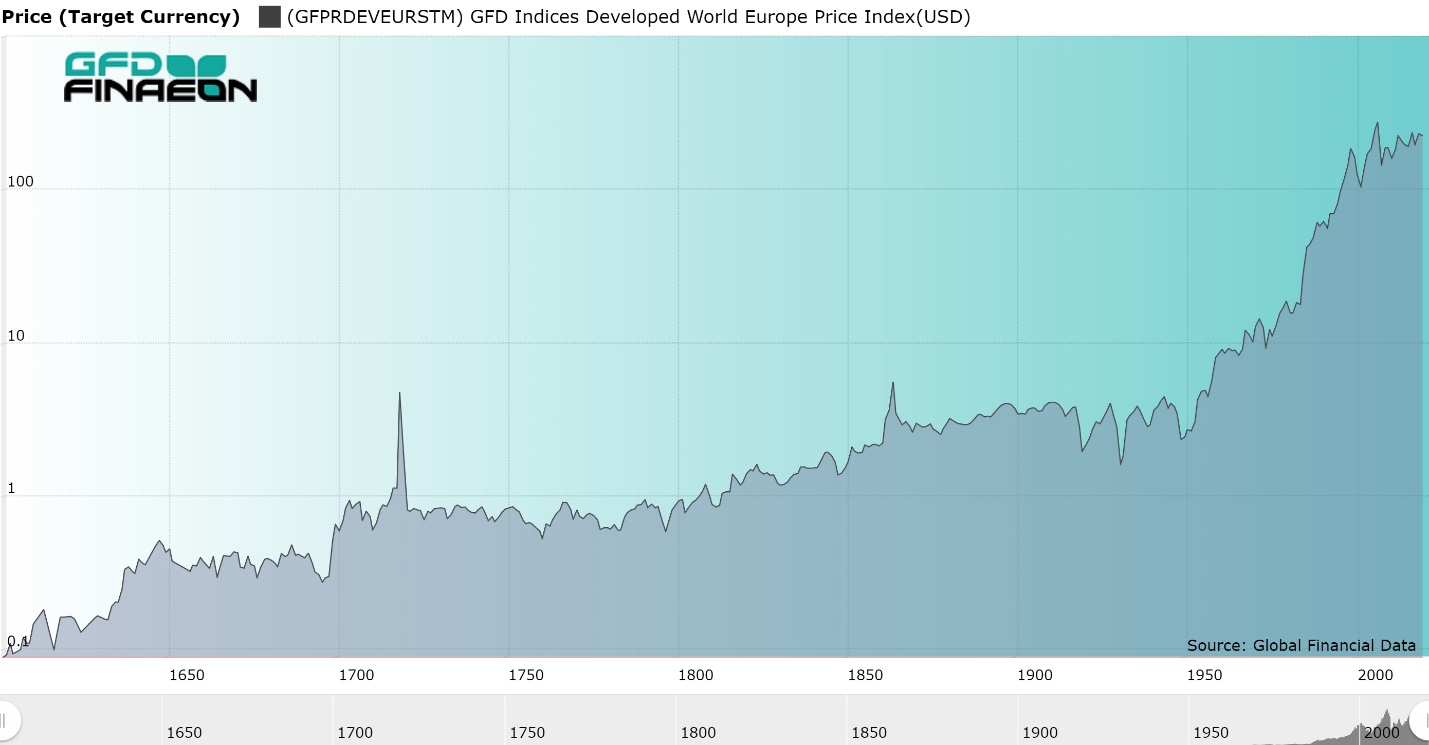
Figure 24. European Stock Price Index, 1601 to 2019
Highest Monthly Average Increase – December (1.03%), April (Up 65.07% of Time)
Lowest Monthly Average Increase – September (-0.40%), October (Up 50% of Time)
Greatest Single Monthly Increase – June 1864 (23.63%)
Greatest Single Monthly Decline – September 1949 (-27.15%)
Highest Quarterly Average Increase – December-February (1.89%, Up 65.50% of Time)
Lowest Quarterly Average Increase – August-October (-0.14%), September-November (Up 47.37% of Time)
Highest Monthly Average Increase Since 1900 – April (1.75%, Up 72.27% of Time)
Lowest Monthly Average Increase Since 1900 – September (-0.73%), June (Up 44.92% of Time)
Greatest Single Monthly Increase Since 1900 – January 1975 (20.66%)
Greatest Single Monthly Decline Since 1900 – September 1949 (-27.15%)
Highest Quarterly Average Increase Since 1900 – December-February (2.78%, Up 70.59% of Time)
Lowest Quarterly Average Increase Since 1900 – May-July (-0.61%, Up 38.98% of Time)
Monthly Scorecard
January
Largest Monthly Increase – Brazil, Denmark, Finland, Germany, Ireland, Italy, Japan, Mexico, Netherlands, Norway, Philippines, Portugal, Singapore, Spain, Sweden, Switzerland, Taiwan, Thailand, Turkey
Most Monthly Increases – Argentina, Australia, Austria, Belgium, Brazil, Denmark, Finland, Germany, Japan, Mexico, Netherlands, New Zealand, Norway, Philippines, Portugal, Russia, Singapore, Spain, Sweden, Switzerland, Turkey
Fewest Monthly Increases – United States
Best Month – Denmark (1925), Japan (1949), Portugal (1980), Singapore (1975), Thailand (1998), World x/USA (1975)
Worst Month – Austria (1938)
Largest Quarterly Increase – Switzerland, Turkey, United Kingdom, United States
Most Quarterly Increases – Canada, Singapore, South Africa, Switzerland, Thailand, Turkey, United Kingdom, World
Largest Monthly Increase Since 1900 – Australia, Brazil, Canada, Denmark, Finland, France, Germany, Italy, Japan, Mexico, Netherlands, Norway, Philippines, Portugal, Singapore, Spain, Sweden, Switzerland, Taiwan, Thailand, Turkey
Most Monthly Increases Since 1900 – Argentina, Australia, Austria, Belgium, Brazil, Denmark, Finland, Germany, Ireland, Japan, Mexico, Netherlands, Norway, Philippines, Portugal, Russia, Singapore, Spain, Sweden, Switzerland, Turkey
Best Month Since 1900 – Denmark (1925), Japan (1949), Portugal (1980), Singapore (1975), Thailand (1998), United Kingdom (1975), World x/USA (1975), Europe (1975)
Worst Month Since 1900 – Austria (1938)
Largest Quarterly Increase Since 1900 – Canada, Switzerland, Turkey, United Kingdom, United States, World
Most Quarterly Increases Since 1900 – Canada, Singapore, Switzerland, Thailand, Turkey, United Kingdom, World
February
Largest Monthly Increase – Argentina, Belgium, India
Most Monthly Increases – Chile, China, Italy
Best Month – Hong Kong (1973), Israel (1984), Mexico (1988)
Worst Month – Finland (2001)
Largest Quarterly Increase – Australia, Belgium, Brazil, Denmark, France, Germany, Hong Kong, Indonesia, Ireland, Italy, Japan, Malaysia, Mexico, Singapore, Spain, Sweden, Taiwan, Thailand, World x/USA, Europe
Most Quarterly Increases – Argentina, Belgium, Brazil, Denmark, Finland, France, Germany, Indonesia, Ireland, Israel, Italy, Japan, Malaysia, Mexico, New Zealand, Norway, Singapore, Spain, Sweden, Taiwan, World x/USA, Europe
Largest Monthly Increase Since 1900 – Argentina, Belgium, Ireland
Most Monthly Increases Since 1900 – Chile, China, Italy
Best Month Since 1900 – Brazil (1988), Hong Kong (1973), Ireland (1975), Israel (1984), Mexico (1988)
Worst Month Since 1900 – Finland (2001)
Largest Quarterly Increase Since 1900 – Australia, Belgium, Brazil, Denmark, France, Germany, Hong Kong, Indonesia, Italy, Japan, Malaysia, Mexico, Singapore, South Africa, Spain, Sweden, Taiwan, Thailand, World x/USA, Europe
Most Quarterly Increases Since 1900 – Argetina, Australia, Belgium, Brazil, Denmark, Finland, France, Germany, Indonesia, Ireland, Israel, Italy, Japan, Malaysia, Mexico, Norway, Philippines, Russia, Singapore, South Africa, Spain, Sweden, Taiwan, World x/USA, Europe
March
Smallest Monthly Increase – Austria, Hong Kong, Thailand
Fewest Monthly Increases – Australia, Thailand
Best Month – Spain (1986)
Worst Month – Brazil (1990), China (1993), France (1848), Sweden (1932)
Largest Quarterly Increase – Finland, Netherlands, Norway, Philippines, Portugal
Most Quarterly Increases – Austria, Chile, Netherlands, Portugal
Fewest Quarterly Increases – United States
Largest Monthly Increase Since 1900 – Austria, Hong Kong, Thailand
Fewest Monthly Increases Since 1900 – India, Thailand
Best Month Since 1900 – India (1992), Spain (1986)
Worst Month Since 1900 – Brazil (1990), China (1993), Sweden (1932)
Largest Quarterly Increase Since 1900 – Finland, Ireland, Netherlands, Norway, Philippines, Portugal
Most Quarterly Increases Since 1900 – Austria, Chile, Netherlands, Portugal
Fewest Quarterly Increases Since 1900 – United States
April
Largest Monthly Increase – Canada, Israel, New Zealand, South Korea, United States
Most Monthly Increases – Hong Kong, Israel, United States, World x/USA, Europe
Best Month – Belgium (1935), Brazil (1990), Malaysia (1999), Norway (1983), South Kore (1962), United States (1933)
Worst Month – Hong Kong (1973), Japan (1920)
Largest Quarterly Increase – Canada, South Korea
Most Quarterly Increases – China, India, Russia, South Korea
Largest Monthly Increase Since 1900 – Israel, South Korea, United Kingdom, United States, World, World x/USA, Europe
Most Monthly Increases Since 1900 – France, Hong Kong, Israel, United Kingdom
Best Month Since 1900 – Belgium (1935), Malaysia (1999), Norway (1983), South Korea (1962), United States (1933), World (1933)
Worst Month Since 1900 – Hong Kong (1973), Japan (1920)
Largest Quarterly Increase Since 1900 – Israel, South Korea
Most Quarterly Increases Since 1900 – China, Russia, South Korea
May
Largest Monthly Increase -- China
Smallest Monthly Increase – Germany, Spain
Most Monthly Increases – India, Ireland
Fewest Monthly Increases – Argentina, Mexico, Norway, Russia, Turkey
Best Month – China (1992), France (1814), South Africa (1897)
Worst Month – Canada (1932)
Largest Quarterly Increase – China, India
Smallest Quarterly Increase – New Zealand, Turkey
Most Quarterly Increases – India
Fewest Quarterly Increases – New Zealand
Largest Monthly Increase Since 1900 == China
Smallest Monthly Increase Since 1900 – Germany, Spain
Fewest Monthly Increases Since 1900 – Argentina, Mexico, Norway, Russia
Best Month Since 1900 – Canada (1933), China (1992)
Worst Month Since 1900 – Canada (1932)
Largest Quarterly Increase Since 1900 – China, New Zealand
Smallest Quarterly Increase Since 1900 – Turkey
Fewest Quarterly Increases Since 1900 – Turkey
June
Smallest Monthly Increase – Belgium, Canada, France, South Africa
Fewest Monthly Increases – Austria, Belgium, Canada, Netherlands, Spain
Best Month – Finland (1945), Ireland (1847), United Kingdom (1720), Europe (1864)
Worst Month – Germany (1948)
Largest Quarterly Increase – India
Fewest Quarterly Increases – Finland, Norway, Sweden
Largest Monthly Increase Since 1900 – Belgium
Smallest Monthly Increase Since 1900 – France, South Africa
Fewest Monthly Increases Since 1900 – Austria, Belgium, Canada, Denmark, France, South Africa, Spain, United Kingdom, World, World x/USA, Europe
Best Month Since 1900 – Finland (1945)
Worst Month Since 1900 – Germany (1948)
Most Quarterly Increases Since 1900 – New Zealand
Fewest Quarterly Increases Since 1900 – Finland, Norway, Sweden
July
Smallest Monthly Increase – China, India
Fewest Monthly Increases – India, Taiwan
Most Monthly Increases – South Korea
Best Month – Germany (1948), Turkey (1987)
Largest Quarterly Increase -- Israel
Smallest Quarterly Increase – Germany, Portugal, South Africa
Fewest Quarterly Increases – Argentina, Austria, Canada, France, Israel, Portugal, Russia, South Africa, Spain
Best Month Since 1900 – Germany (1948), Turkey (1987)
Smallest Monthly Increase Since 1900 – China
Most Monthly Increases Since 1900 – South Korea
Fewest Monthly Increases Since 1900 -- Taiwan
Smallest Quarterly Increase Since 1900 – France, Germany, Israel, Portugal, South Africa, United Kingdom, World x/USA, Europe
Fewest Quarterly Increases Since 1900 – Argentina, Austria, Canada, China, France, Germany, Israel, Portugal, Russia, South Africa, Spain, United Kingdom, World, World x/USA, Europe
August
Largest Monthly Increase – Austria, France, Russia
Smallest Monthly Increase – Malaysia, Philippines, Singapore, South Korea, Turkey
Most Monthly Increases – France, South Africa
Fewest Monthly Increases – Hong Kong, Indonesia, Ireland, Malaysia, Philippines, Singapore, South Korea
Best Month – Austria (1922), Canada (1837), Chile (1973), India (1720), New Zealand (1989), Russia (1994), Taiwan (1987), World (1719)
Worst Month – Indonesia (1997), Russia, (1998), South Africa (1998), Turkey (1998)
Largest Quarterly Increase – Austria, Russia, World
Smallest Quarterly Increase – Belgium
Fewest Quarterly Increases – Belgium, Israel
Largest Monthly Increase Since 1900 – Austria, Russia
Smallest Monthly Increase Since 1900 – India, Ireland, Malaysia, Philippines, Singapore, South Korea, Turkey
Most Monthly Increases Since 1900 – South Africa
Fewest Monthly Increases Since 1900 – Hong Kong, Indonesia, Ireland, Malaysia, Philippines, Singapore, South Korea
Best Month Since 1900 – Austria (1922), Chile (1973), New Zealand (1989), Russia (1994), Taiwan (1987)
Worst Month Since 1900 – Indonesia (1997), Russia (1998), South Africa (1998), Taiwan (1998)
Largest Quarterly Increase Since 1900 – Austria, Russia
Smallest Quarterly Increase Since 1900 – Belgium
Fewest Quarterly Increases Since 1900 – Belgium, Ireland, Israel
September
Largest Monthly Increase – Chile
Smallest Monthly Increase – Australia, Denmark, Finland, Indonesia, Netherlands, Norway, Sweden, Switzerland, United Kingdom, United States, World, World x/USA, Europe
Fewest Monthly Increases – Denmark, Japan, Sweden, Switzerland
Worst Month – Chile (1970), India (1720), Philippines (1987), United Kingdom (1720), United States (1931), World x/USA (1949), Europe (1949)
Largest Quarterly Increase -- Chile
Smallest Quarterly Increase – China, Hong Kong, India, Malaysia, Philippines, Singapore
Fewest Quarterly Increases – China, Hong Kong, India, Indonesia, Malaysia, Philippines, Taiwan
Largest Monthly Increase Since 1900 – Chile
Smallest Monthly Increase Since 1900 – Australia, Denmark, Finland, Indonesia, Norway, Sweden, Switzerland, United Kingdom, United States, World, World x/USA, Europe
Fewest Monthly Increases Since 1900 – Germany, Japan, Sweden, Switzerland, United States
Worst Month Since 1900 – Chile (1970), Philippines (1987), United States (1931), World (1931), World x/USA (1949), Europe (1949)
Largest Quarterly Increase Since 1900 – Chile
Smallest Quarterly Increase Since 1900 – China, Hong Kong, Malaysia, Philippines, Singapore
Fewest Quarterly Increases Since 1900 – China, Hong Kong, Indonesia, Malaysia, Philippines, Taiwan
October
Smallest Monthly Increase – Argentina, Ireland, Japan, Mexico, Russia, Taiwan
Fewest Monthly Increases – France, Germany, South Africa, United Kingdom, World, World x/USA, Europe
Best Month – Netherlands (1936), Switzerland (1936)
Worst Month – Australia (1987), Belgium (1987), Denmark (2008), Ireland (1987), Italy (1947), Malaysia (1987), Netherlands (1987), Norway (1987), Portugal (1987), Singapore (1987), South Korea (1964), Spain (1987), Switzerland (1987), Taiwan (1987), Thailand (2008), World (1720)
Smallest Quarterly Increase – Indonesia, Ireland, Japan, Mexico, Netherlands, South Korea, Sweden, Taiwan, United States, World x/USA, Europe
Fewest Quarterly Increases – China, Indonesia, Ireland, japan, Netherlands, Singapore, South Korea, Thailand, United Kingdom, World x/USA
Smallest Monthly Increase Since 1900 – Argentina, Canada, Japan, Mexico, Russia, Taiwan
Best Month Since 1900 – Australia (1930), France (1936), Netherlands (1936), Switzerland (1936)
Worst Month Since 1900 – Australia (1987), Belgium (1987), Denmark (2008), France (1987), India (2008), Ireland (1987), Italy (1947), Malaysia (1987), Netherlands (1987), New Zealand (1987), Norway (1987), Portugal (1987), Singapore (1987), south Korea (1964), Spain (1987), Switzerland (1987), Taiwan (1987), Thailand (2008), United Kingdom (1987)
Smallest Quarterly Increase Since 1900 – Canada, India, Indonesia, Ireland, Japan, Mexico, Netherlands, South Korea, Sweden, Taiwan, United States, World
Most Quarterly Increases Since 1900 – India
Fewest Quarterly Increases Since 1900 – China, Indonesia, Japan, Netherlands, Singapore, South Korea, Thailand
November
Smallest Monthly Increase – Brazil, Chile, New Zealand
Fewest Monthly Increases – Brazil, Chile, Finland, Indonesia, New Zealand
Best Month – Sweden (1992)
Worst Month – Mexico (1987), New Zealand (1862)
Largest Quarterly Increase – Austria, Canada
Smallest Quarterly Increase – Australia, Brazil, Denmark, Finland, France, Italy, New Zealand, Norway, Russia, Spain, Switzerland, Thailand, United Kingdom, World
Fewest Quarterly Increases – Brazil, China, Denmark, Germany, Italy, New Zealand, Switzerland, World, Europe
Smallest Monthly Increase Since 1900 – Brazil, Chile
Fewest Monthly Increases Since 1900 – Brazil, Chile, Indonesia
Best Month Since 1900 – Sweden (1992)
Worst Month Since 1900 – Mexico (1987)
Largest Quarterly Increase Since 1900 – Australia, Austria
Smallest Quarterly Increase Since 1900 – Brazil, Denmark, Italy, New Zealand, Norway, Russia, Switzerland, Thailand
Fewest Quarterly Increases Since 1900 – Brazil, China, Denmark, Finland, Italy, Switzerland
December
Largest Monthly Increase – Australia, Hong Kong, Indonesia, Malaysia, South Africa, United Kingdom, World, World x/USA, Europe
Most Monthly Increases – Canada, Indonesia, Malaysia, Taiwan, United Kingdom, World
Fewest Monthly Increases – China, New Zealand
Best Month – Australia (1852), Indonesia (1988), Italy (1943)
Worst Month – Israel (1977)
Largest Quarterly Increase – Argentina, Chile, South Africa
Most Quarterly Increases – Hong Kong, United States
Fewest Quarterly Increases – Chile, Mexico
Largest Monthly Increase Since 1900 – Hong Kong, India, Indonesia, Malaysia, South Africa
Most Monthly Increases Since 1900 – Canada, India, Indonesia, Malaysia, Taiwan, World
Fewest Monthly Increases Since 1900 -- China
Best Month Since 1900 – Indonesia (1988), Italy (1943), South Africa (1973)
Worst Month Since 1900 – Israel (1977)
Largest Quarterly Increase Since 1900 – Argentina, Chile, India
Most Quarterly Increases Since 1900 – Hong Kong, United States
Fewest Quarterly Increases Since 1900 – Chile, Mexico, New Zealand