At about $1 trillion, Brazil’s stock market is among the twenty largest stock markets in the world, equal to about half of the country’s GDP. The first stock exchange opened in Brazil in 1817, the Rio de Janeiro Stock Exchange opened in 1820, and the Sao Paulo Stock Exchange opened in 1890. Brazilian stocks began listing in London in 1825 when three Brazilian mining companies took advantage of London’s interest in South America to list their shares. Between 1825 and 1985, 65 Brazilian companies listed in London.
Despite this long history, Brazil is an emerging market for which it is difficult to provide an accurate, long-term stock index because of the inflation that wrecked the economy in the late 1900s. Between 1967 and 1994, Brazil went through five currencies and inflation averaged over 182% per annum, with inflation exceeding 1000% each year between 1988 and 1994. In February 1990, interest rates hit a daily rate of 3.626%, which works out to over 790,000% per annum. The debt market for bonds and bills became almost non-existent. Brazil was finally able to tame its inflation addiction in 1994 when it replaced the Cruzeiro with the Real. As a result of decades of inflation, it took 2.75 quintillion (2,750,000,000,000,000,000) reis of the 1800s to obtain 1 real of money today. Even since the currency was stabilized in 1994, the stock market has continued on a roller coaster ride. How could an economy or stock market function under such circumstances?
Brazilian stock index data is available since 1954 when the SN Index which used companies from both the Rio de Janeiro and Sao Paulo stock exchanges was introduced. An index for Rio began in 1955 and the Bovespa index from Sao Paulo starts in 1968. Since Brazilian stocks have traded on the London Stock Exchange since 1825, we can calculate an index of London shares and append this index onto the Bovespa to create an index of Brazilian shares that stretches from 1825 until today.
Among the more prominent Brazilian companies that listed in London were the Brazilian Traction, Light and Power Co. (later renamed Brascan), which existed between 1912 and 1997, the General Mining Association, which existed between 1825 and 1900, the Rio de Janeiro City Improvement Co, which listed from 1862 to 1930, the Sao Paulo Railway Co, which existed between 1883 and 1969, the St. John d’El Rey Mining Co. which listed in London between 1830 and 1969, and the Leopoldina Railway Co. which listed between 1899 and 1952 and inherited railway lines that converged on Rio De Janeiro.
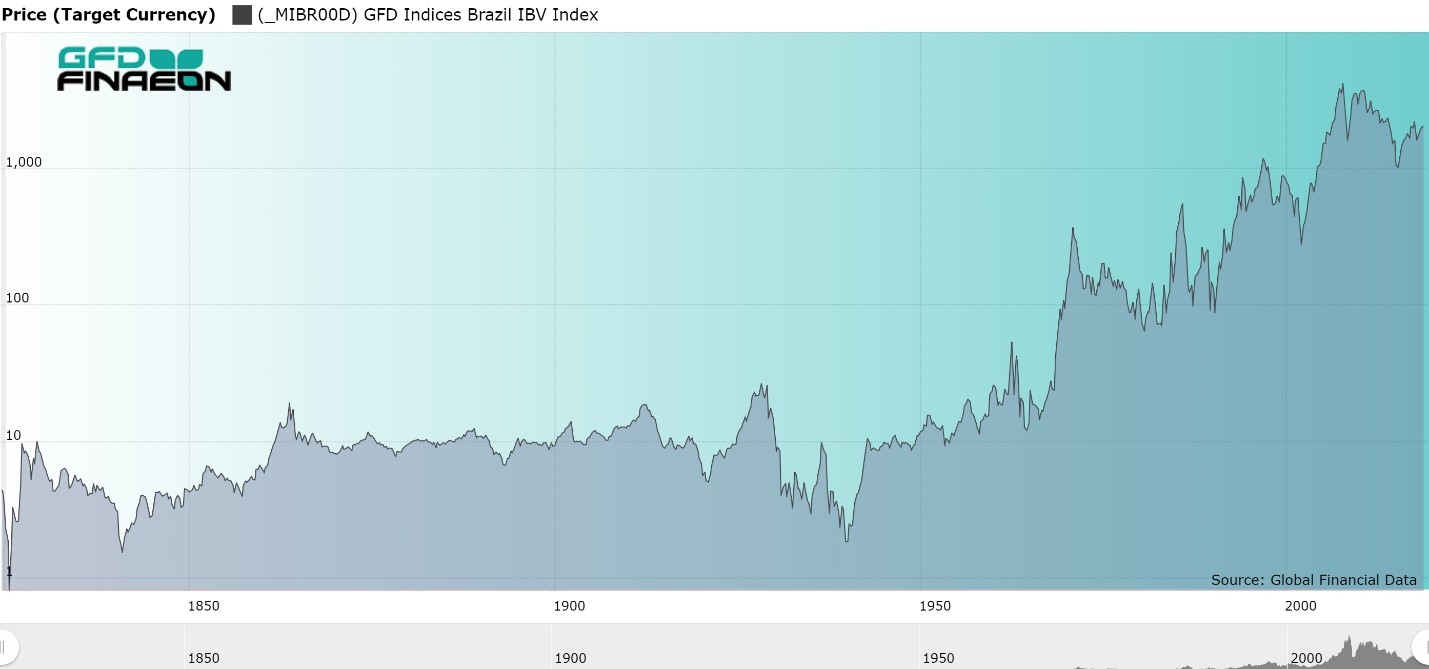
Figure 1. Brazil Stock Price Index, 1825 to 2018 in US Dollars
As Figure 1 shows, Brazilian stocks made little progress until the 1950s. There was little capital appreciation in Brazilian stocks between the 1830s and 1940s, and in some ways, this result was not unexpected. Between the 1820s and 1940s, the index relies upon Brazilian stocks that were listed in London. Brazilian stocks that listed in London provided a total return of 7.13% of which 1.50% came from capital gains and 5.6% came from dividends between 1825 and 1950. Without the dividends, investors would have received little in return from their investment in Brazil. By contrast, between 1824 and 1968, Brazilian government bonds returned 5.81% in USD while Brazilian stocks returned 7.28% providing an equity premium of 2.07%.
It is difficult to measure the long-term equity risk premium after 1968 because no risk-free instrument existed in Brazil’s hyperinflationary environment. With interest rates exceeding 3.6% per day or 790,000% per annum, you might not question whether you are going to get some money back, the only question is how much? No long-term bonds existed between 1968 and the 1990s when U.S. Dollar Brady Bonds were introduced. Real-based bonds were introduced in the 2000s. Consequently, you can calculate the equity risk premium before 1968 and after 1994, but not during the period of hyperinflation.
If you can’t even predict the inflation rate over the next month, how can you predict the inflation rate, and thus the yield on bonds, over a five- or ten-year period? Consequently, there are no benchmarks to compare the return on stocks to any other asset. The whole economy is wrapped up in avoiding inflation. Dividends lose their meaning in a world of 1000% inflation so the total return index differs little from the price index. Before 1994, the dividend yield in Brazil was usually under 1% as inflation quickly wiped out any increases in dividends. Inflation creates problems that investors in non-inflationary countries never have to think about. If you look at returns to investors in a country such as the United States which rarely has had high inflation rates, you can see how returns after inflation sink when inflation hits double digits. What would happen if inflation hit quadruple digits?
We can measure the equity risk premium between 1993 and 2018 using the MSCI Brazil Index and the EMBI U.S. Dollar Bond Index. As measured in U.S. Dollars, between 1993 and 2018, a bond investor would have received a 10.43% annual return while a stock investor would have received a 10.19% annual return. Brazilian government bonds outperformed stocks during the past 25 years. These returns are summarized in Table 1.’
| Equities | Equities | Bonds | ERP | |
| Price | Return | Return | ||
| 1825-1950 | 1.5 | 7.28 | 5.81 | 2.07 |
| 1950-1994 | 9.75 | |||
| 1994-2018 | 6.04 | 10.19 | 10.43 | -0.24 |
| 1825-2018 | 3.42 |
Table 1. Brazil Annual Equity and Bond Returns in U.S. Dollars, 1825-2018
The historical data for Brazil can either be adjusted for inflation, or converted into U.S. Dollars to eliminate the impact of Brazil’s hyperinflation, but because changes in the inflation rate and changes in the exchange rate differ from changes in the stock index, measuring bull and bear markets is difficult. When the inflation rate is 1000% and you are looking for a 20% decline in the index to register a bear market, any misalignment between the stock index and the exchange rate can produce a bear market in U.S. Dollars that didn’t occur in Brazilian Reais or Cruzeiros.
There are periods of rapid growth in Brazilian stock prices followed by a decade or more of no progress in the price of stocks in U.S. Dollars. It is interesting to note that between 1971 and 1993, the worst period of hyperinflation in Brazil’s history, despite prices rising a trillion-fold in Cruzeiros, the stock index made almost no progress in nominal US Dollars.
Even after you convert Brazilian stock prices into US Dollars, the market has gone through wild fluctuations. The stock market increased in price 20-fold between 1966 and 1971 generating an 82% annual return, but the index was at the same level 22 years later in 1993 as it had been at in 1971. The market increased 40-fold between 1990 and 2007 generating a 25% annual rate of return. However, since 2007, the Brazilian stock market has lost half of its value. At its bottom in 2016, the market was no higher than it had been in 1997. There is nothing new in this volatility. Between 1929 and 1939, the Brazilian stock market lost 90% of its value providing one of the worst returns in the world during the Great Depression.
Ride the Bull, but Get Off After That
The main conclusion you can make from all of this evidence is that Brazil is not a buy-and-hold market because it is a roller coaster with periods of tremendous gains followed by periods of a decade or more in which the stock market makes no progress. In short, Brazil is a place for market timers, and very adept market timers at that. If your timing is off, you will pay the price. In 2008 during the financial crisis, the Brazilian market declined by over 73%. In 2019, the stock market is at the same place it was at in 2006.
This is the basic problem with most emerging markets. Because of their uncertain political environment, they have an uncertain economic environment. Investors rush in when it looks like the country has changed and is ready to adopt and apply the tenants of free markets and open trade, but when things go awry, the country can linger in the doldrums for a decade or more. Nevertheless, over time the good periods of high returns in Brazil have more than offset the decade or two of low returns. While the S&P 500 returned 9.07% per annum between 1993 and 2018, Brazilian stocks returned 10.19% and bonds 10.43%. Whether that extra return is worth the extra volatility it entails is up to the individual investor. Most investors would rather avoid the risk, but if you can catch the next meteoric rise in Brazilian stocks, you will be rewarded.