REQUEST A DEMO with a GFDFinaeon Specialist
The AMEX has generally been ignored by investors, but this article attempts to redress that neglect.

The S&P 500 reached new highs last week causing some analysts to call this the fastest recovery from a bear market in history; however, this shows that many analysts are not looking at the whole picture -- since they are ignoring the recovery that followed the start of World War I in 1914.

Global Financial Data has revised its sector and industry classification system and has added comparison with the GICS and SIC classification system to help users understand the differences between the three systems.

Global financial Data has calculated a new World Index that extends from the beginning of stock markets in Amsterdam in 1601 to the present day. It will succeed the original World Index that GFD first calculated 20 years ago. With the World Index 2.0 we can clearly distinguish the four eras that the stock market has evolved through during the past 400 years: Mercantilism, Free Trade, Regulation and Globalization. We can analyze how the stock market behaved in each of the four eras as well as each global bull and bear market the market has passed through during the past 400 years. Until now, no one has calculated a World Index that
...
Co-Authored by Michelle Kangas & Dr. Bryan Taylor
Warrant Buffett once said that the stock market capitalization to GDP Ratio (MC/GDP) is “probably the best measure of where valuations stand at any given moment.” Global Financial Data has decided to follow in Warren Buffett’s footsteps and has added data on the ratio of stock market capitalization to GDP for all the stock markets in the world. GFD has the most extensive historical data on stock market capitalization and GDP available anywhere. This enables us to provide data on Buffett’s favorite indicator going back centuries, not decades.
...
Global Financial Data has added over 600 files to its database that provide data on government revenues, government expenditures, the primary balance, interest paid on public debt and the amount of outstanding government debt as a share of GDP. The data cover 56 countries on government revenues, expenditures and interest expense and 200 countries on outstanding government debt.
GFD has combined its extensive database of historical data on government revenues, expenditures and debt with the recent work of Ayhan, Kurlat, Ohnsorge and Sugawara in their paper, “A Cross-Country Database of Fiscal Space” and of Mauro, Romeu, Binder
...Global Financial Data has added over 30 new Consumer Price and Producer Price Indices to its database as well as 25 new Unemployment Rates.

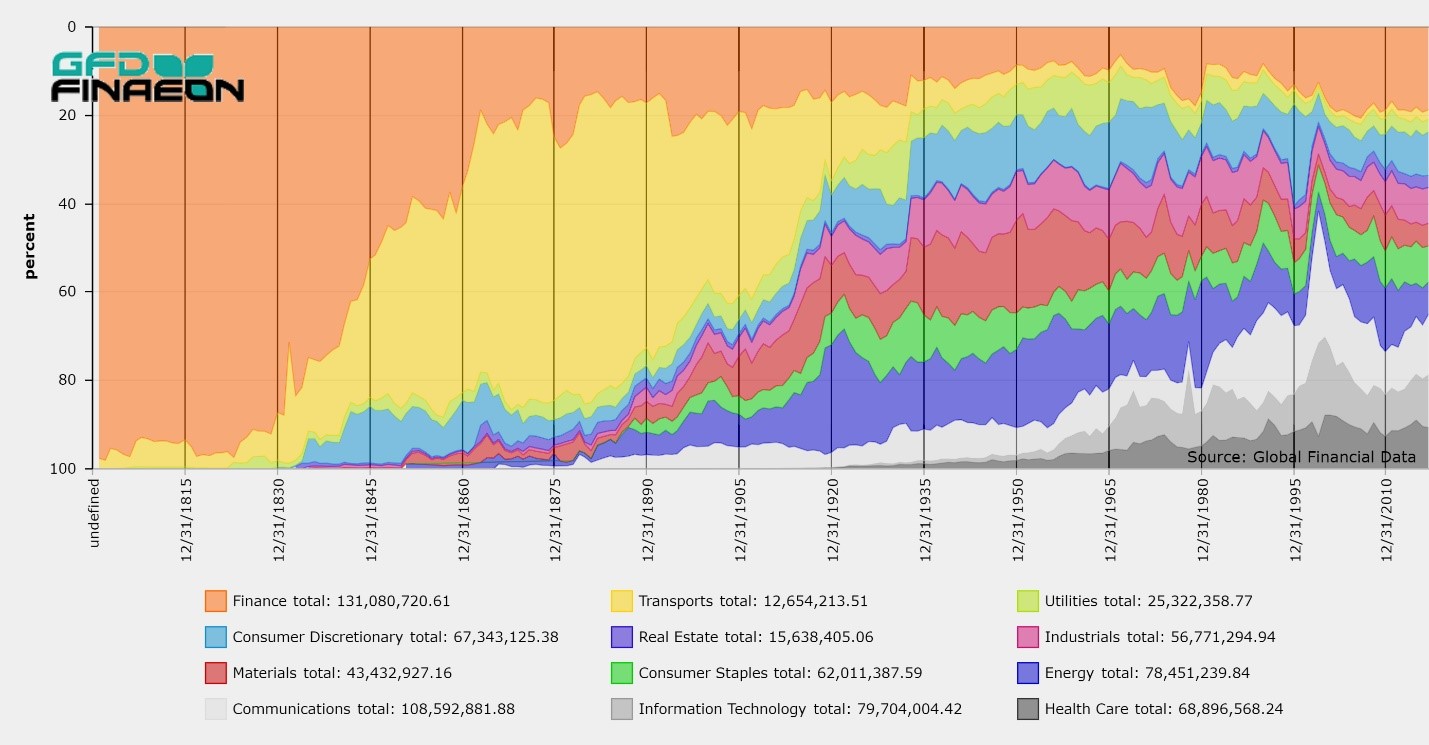
Global Financial Data has added a number of sectors to its collection of S&P Sector Indices for the S&P 500 Composite, S&P 400 Midcap, S&P 600 Small Cap and S&P 1500 Supercomposite. During the past few years, S&P has substantially revised its indices and made two major changes. First, S&P added Real Estate as one of the eleven sectors that it divides the stock market into. The reason for this addition is the growth in REITs as investment vehicles. Before this change, real estate stocks were part of the Finance sector. Second, the Telecommunications sector was reorganized as the Communication Services sector.
...
Global Financial Data has collected extensive data on stocks from the United States and the United Kingdom covering over 400 years. With this, GFD plans to generate indices that cover the history of the stock market from the incorporation of the Dutch East India Company in 1602 to the current market in 2018. GFD will provide a general index, sector indices and size indices.
One question which the creation of size indices creates is how many components should be in the large cap, midcap and small cap indices. Where should large cap, midcap and small cap begin and end? Currently, each index company treats large cap, midcap and
...
Everyone hates Covid-19 and the way it has disrupted our lives. The Covid pandemic has shut down the world and led to the layoff of millions of workers. Unemployment has soared, GDP has declined, and businesses have gone bankrupt. With winter arriving in the northern hemisphere, Covid cases are likely to increase. The main consolation is that a vaccine is on the way, and once it is available, life can hopefully return to the pre-pandemic “normal” which we all enjoyed.
Our comprehensive financial databases span global markets offering data never compiled into an electronic format. We create and generate our own proprietary data series while we continue to investigate new sources and extend existing series whenever possible. GFD supports full data transparency to enable our users to verify financial data points, tracing them back to the original source documents. GFD is the original supplier of complete historical data.
