Five Financial Eras
Dr. Bryan Taylor, Chief Economist, Global Financial Data
Abstract
This paper presents an analysis of financial history over the past eight centuries by breaking the past up into five historical eras and twenty historical periods. There is a pattern of high equity returns being followed by periods of low equity returns that has existed over the past 400 years. Similar patterns at different intervals have been found for fixed income. This process produces different equity risk premia in different periods. The paper presents evidence on the factors that define the beginning and end of each period and why the returns in one period differ from the next. Each period is separated by geopolitical events, such as the end or beginning of a war (1815, 1914, 1945), a stock market bubble (1720, 1929, 2000), a secular low or high in interest rates (1896, 1981, 2020) or similar events. These events signal a change in the zeitgeist of the period and consequently a change in the returns to stocks, bonds, bills and the equity risk premium. For each period, documentation is provided on wars, trade, the government, returns to stocks and bonds, inflation, bear markets, financial crises, interest rates and exchange rates. An understanding of the factors influencing financial eras and periods will improve our understanding of the returns to stocks, bonds and bills and the equity risk premium in the future.
Every generation has a financial zeitgeist, an overwhelming spirit that pervades society, politics and the economy. Economic cycles have been proposed by Kitchin (3-5 years), by Juglar (7-11 years), by Kuznets (infrastructural investment cycle of 15-25 years) and by Kondratiev (a wave of 45-60 years). This paper extends the study of economic cycles by looking at financial cycles.
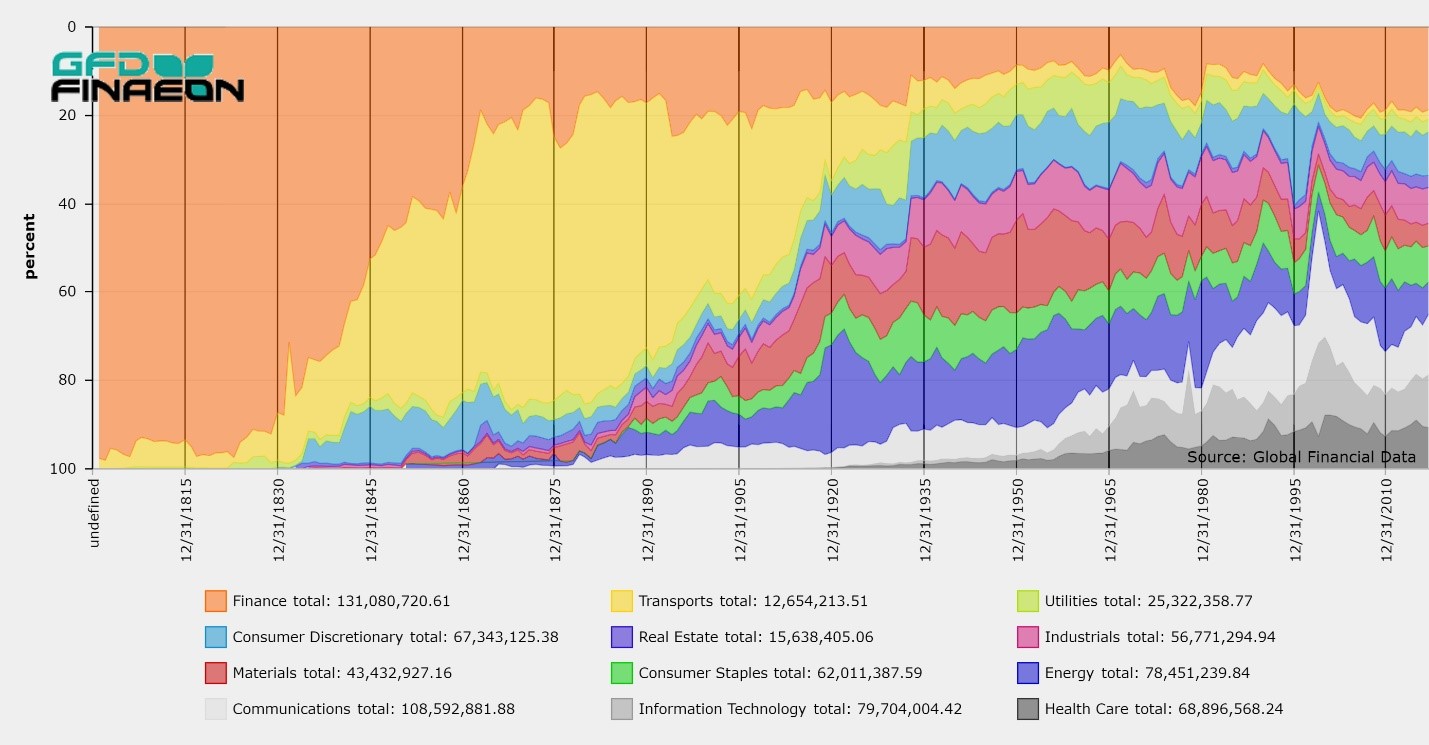
The Five Financial Eras
Fernand Braudel introduced the concept of la longue durée, focusing on long-term socioeconomic trends in history rather than individual events. He applied his analysis to Europe between the 1400s and 1700s. These concepts can apply to finance as easily as it can to economics. We have broken down the past eight centuries into five financial eras:
| Years | Era | Description | Center |
| 1252-1601 | Financial Renaissance | Commodities, currencies and bonds traded | Venice, Antwerp |
| 1602-1815 | Mercantilism | Stocks and bonds traded in Europe | Amsterdam, London |
| 1816-1914 | Free Trade | Stocks and bonds traded globally | London, Paris |
| 1915-1981 | Keynesianism | Restrictions on stocks and bonds | New York |
| 1982- | Globalization | Electronic trading on global exchanges | New York |
During the Financial Renaissance (1252-1601), exchanges primarily traded commodities and currencies. Gold coins were first minted in Florence in 1252 and in Venice in 1284. These cities had sufficient capital that they could mint their own coins, rather than rely upon Arab gold, and this signaled the rise of Italy as an important financial center. Venice imposed forced loans on its richer inhabitants in 1171-1172 and issued its first bonds in 1262. Italy was the financial center of Europe between the 1200s and the 1500s. Although governments in Italy, Germany, France, the Netherlands and Spain issued bonds, the trading of bonds was not organized on exchanges. Shares in the first joint-stock company, the Muscovy Co., were issued in 1555.
During the period of Mercantilism, (1602-1789), exchanges in Amsterdam, Copenhagen, London and Paris began trading both stocks and bonds. Shares of the Dutch Duo (the Dutch East India Co. and the Dutch West India Co.), the French Compagnie des Indes Orientales, the British East India Co., the Bank of England and the South Sea Co. as well as a number of smaller companies traded in Europe. Although the market capitalization of stocks traded in London grew from less than 1% of GDP in 1700 to 22% in 1789, outstanding British government debt, which primarily existed in the form of 3% Consols, grew from 5% of GDP in 1689 to 158% in 1789. Shares in the Dutch East India Co. stock began trading in Amsterdam in 1602, and shares in the Dutch West India Co. began trading in 1623. Shares started trading in London regularly in the 1690s and by 1720, trading in over a dozen companies was occurring in Amsterdam, London and Paris. Because of the wars of the 1700s, the amount of outstanding government bonds grew much more dramatically than the capitalization of stock markets. The French Revolution of 1789 signaled a break with the past.
After the end of the Napoleonic Wars in 1815, the era of Free Trade began, and the “long century” of peace between 1815 and 1914 enabled Europe to industrialize. There was a dramatic change in financial markets in the 1790s. The Dutch Duo both went bankrupt, and all French corporations were shut down during the French Revolution. The United States, France, the Netherlands, and Denmark all defaulted on and reorganized their government debts. All other countries, except for England, temporarily suspended interest payments. In the 1790s, the number of canals incorporated in England grew dramatically leading to a bubble in canal shares. Dozens of finance companies were established in the United States. The Banque de France was established in 1801.
Trading was limited to a small number of European companies until the 1790s when the number of companies in England, the United States and other countries increased dramatically. Before 1800, there was rarely activity in more than a dozen stocks in London, but beginning in 1805, the number of stocks being traded exploded, reaching 100 in 1814, 200 in 1824, and 300 in 1832. During the 1840s, railroads were built in every major European country, and soon the telegraph, oceanic cables, the Suez canal, and railroads established communications throughout the world. There were few wars between 1815 and 1914 and stock market capitalization grew relative to government debt. While British government debt shrank from 182% of GDP in 1815 to 29% in 1914, British stock market capitalization grew from 17% to 122% of GDP. By 1914, every developed country in Europe had exchanges that traded stocks and bonds and the gold standard enabled financial assets to be freely traded across borders.
The era of Free Trade was followed by Keynesianism during which there was financial repression in which governments controlled financial markets and Communist countries eliminated stock exchanges completely. World War I closed global stock markets on July 31, 1914. For the next 70 years, governments regulated exchanges and limited the flow of funds across international borders. Russia, China and Eastern Europe replaced Capitalism with Communism and closed exchanges in their countries. European governments nationalized industries, and the United States regulated corporations. Stock market capitalization shrank throughout the world. France’s market capitalization as a share of GDP fell from 58% in 1914 to 7% in 1981, the UK from 122% to 38%. Central banks allowed inflation to increase in the 1970s, causing interest rates and bond yields to rise imposing losses on fixed-income investors. By 1981, neither stocks nor bonds were providing sufficient returns. Many investors had lost their faith in financial assets.
Beginning in 1982, an era of Globalization began that allowed stock and bond markets to grow in every country in the world. Paul Volcker raised interest rates to defeat inflation. European governments privatized nationalized industries and the market capitalization of French stocks as a share of GDP rose from 7% in 1981 to 106% in 1999. Communist governments in Russia, China and Eastern Europe all reintroduced stock exchanges to trade shares in privatized companies, and emerging markets established and expanded local stock exchanges. By 2000, there were stock exchanges in over 100 countries. The internet and improvements in telecommunications enabled information to travel around the world instantaneously. Returns to both stocks and bonds were the highest in history during the 1980s and 1990s. By the 2020s, stock and bond markets were increasingly integrated. During the Covid crisis in 2020, global stock markets moved in lockstep with each other. Although there appears to be some degree of de-globalization during the 2020s, financial markets remain highly integrated worldwide.
The returns for each of the most recent four eras to stocks, bonds and bills are provided in Table 1. The return to stocks has risen over time. Returns to stocks are above the average during the current era of Globalization and may revert to the historic mean of around 5% in real terms. The return to bonds was negative during the period of financial repression between 1914 and 1981. The return to bills was negative between 1914 and 1981 and has been low during the period of Globalization. Inflation has been higher since World War I than before.
| Period | Era | Stocks | Bonds | Bills | ERP | Inflation |
| 1700-1815 | Mercantilism | 4.59 | 3.71 | 4.07 | 0.86 | 0.55 |
| 1816-1914 | Free Trade | 5.36 | 3.53 | 3.71 | 1.77 | 0.66 |
| 1914-1981 | Keynesianism | 5.19 | -1.15 | -0.22 | 6.41 | 2.48 |
| 1981-2023 | Globalization | 7.16 | 3.78 | 0.79 | 3.26 | 2.93 |
Table 1. Annual Returns to Stocks, Bonds and Bills, ERP and Inflation in Real USD, 1700 to 2023
Differences in the eras can also be determined by comparing the market capitalization for equities with the size of government debt. During periods of war, you would expect the government to redirect financial resources to funding the wars while limiting the amount of resources that can be invested in the private sector. The periods of Mercantilism (Seven-Years’ War, American Revolution, Napoleonic Wars) and Keynesianism (World War I, World War II, Korean War, Vietnam War) were periods of war, while the periods of Free Trade and Globalization were periods of peace and growth in stock markets.
| Year | France | UK | USA |
| 1700 | 50.73 | ||
| 1815 | 7.82 | 9.58 | 45.16 |
| 1914 | 74.31 | 415.89 | 1786.15 |
| 1981 | 44.89 | 83.15 | 129.54 |
| 2023 | 141.6 | 142.27 | 156.12 |
Table 2. Market Capitalization as a Percentage of Government Debt
Table 2 compares equity market capitalization with the level of government debt for three countries at different points in time. The United Kingdom is the only country for which we have data between 1700 and 1815, and between those two dates, the market cap shrank from 50 percent of government debt to 10 percent. During the period of peace between 1815 and 1914, market cap expanded dramatically compared to government debt, increasing from 10% in the UK to 415% by 1914. During the wars that followed market cap shrank relative to government debt, decreasing in all three countries. After 1981, however, market cap grew relative to government debt. Wars clearly induce governments to reallocate financial resources away from the private sector and into the public sector.