The 2020s have begun. During the 2010s, the fixed-income market has done things no one would have predicted when the 2010s began ten years ago. The most important feature of the past decade has been the steady decline in government bond yields, falling to negative nominal yields in most of Europe and negative real yields in the United States and Canada.
Government bond yields have been declining since 1981 throughout the world. In the United States, the 10-year bond yield was 3.85% at the end of 2009, but has declined to under 1.90% today. The yield on 10-year government bonds in Japan has declined from 1.30% in 2009 to -0.06% in 2019 while German bond yields have declined from 3.37% to -0.30%. Across the world, interest rates are negative in real terms. In Switzerland, even the 50-year bond has a negative return.
I believe that interest rates cannot continue to decline. Why accept a negative return when you can always hold cash with a zero return? There are transaction costs of buying and selling bonds. Although these costs can be easily factored into a long-term bond, this is more difficult with a short-term bond. Will the 38-year bull market in bonds driven by declining yields come to an end? Is a new multi-decade pattern of rising bond yields replacing the declining yields of the past few decades? There are over $10 trillion in outstanding government bonds with negative yields in the world. Many of these bonds are owned by governments so the yield is almost irrelevant. Will bond yields still be negative ten years from now? Will interest rates decline or rise during the decade to come?
The Interest Rate Pyramid
We are currently in a 75-year cycle of rising and falling interest rates. The government controlled interest rates during World War II to limit the government’s cost of funding the debt it issued to pay for the war. When the war was over, the government allowed the market to once again determine bond yields, and the government’s policies fed inflation driving prices and bond yields up between 1945 and 1981. Paul Volker decided to fight inflation at any cost and reversed the pattern of rising inflation and interest rates. Inflation and bond yields have declined since 1981 falling from 15.81% in 1981 to under 2% today.
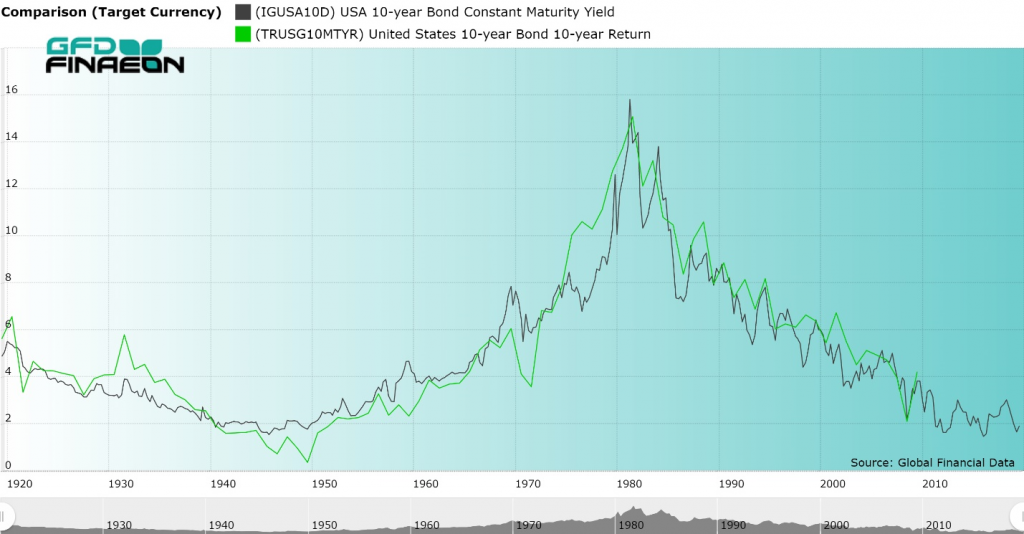
Figure 1. United States 10-year Government Bond Yield and Return, 1919 to 2019
Fixed-income investors are concerned about two factors, the capital gain or loss they receive when there is a change in the bond yield and the interest payments they receive each six months from the government. GFD’s 10-year Total Return Government Bond index takes both of these factors into consideration in calculating the total return to holders of government bonds. During the period of rising interest rates between 1945 and 1981, bondholders received higher interest payments over time, but lost money as higher interest rates drove the price of bonds down. The opposite effect has occurred since 1981.
What is interesting is that the capital gain/loss that occurs because of rising or falling bond yields offsets the interest bondholders receive to even out the return to investors. The assumption is that as the bondholder receives interest payments over time, this money is reinvested in government bonds at the current yield in the market. In theory, the bondholder could completely reinvest his principal and interest in a new bond each year. Bondholders can also invest in mutual funds that effectively do this for them. The interesting thing is that over the past 75 years, the capital gain/loss that has been generated by the rising and falling bond yields has offset the rising and falling coupons that have occurred over time.
Figure 1 compares the yield on the US 10-year bond in black with the total return to an index of bonds invested in 10-year government bonds in green. The return index compares the return to government bond holders between 2008 and 2018 with the yield to government bonds in 2008. Of course, you would have needed to wait until 2018 to find out what the return was to investors in government bonds in 2008, but as Figure 1 shows, the correlation between the yield on government bonds at any point in time and the actual return investors receive over the next ten years is uncanny. The fact that this pattern has persisted for the past 100 years is amazing.
Examining other countries, you get similar results. Figure 2 shows the relationship between bond yields and returns for Japan and Figure 3 shows the relationship for France. The relationship between bond yields and returns is not always as strong as it is in the United States, but the general relationship still exists.
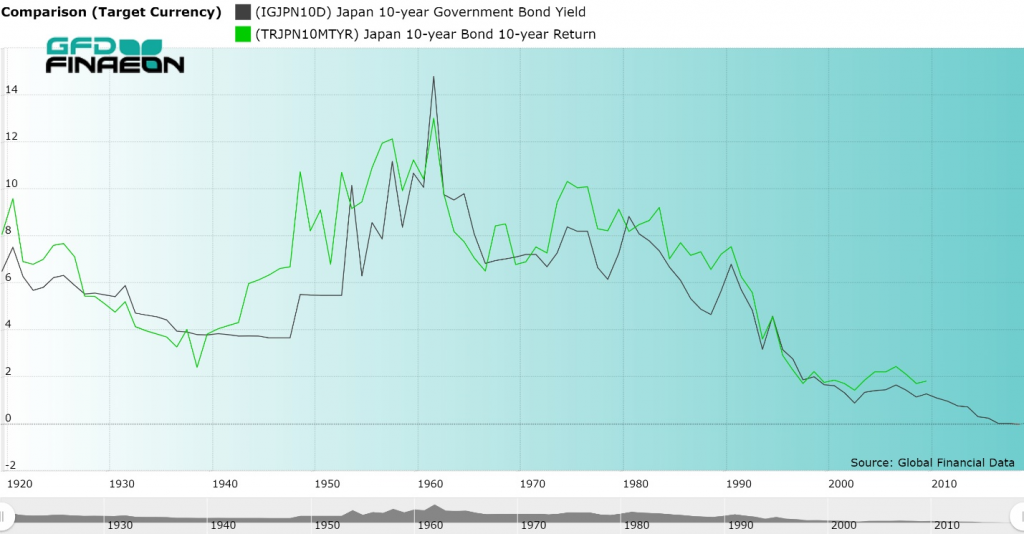
Figure 2. Japan 10-year Government Bond Yield and Return, 1919 to 2019
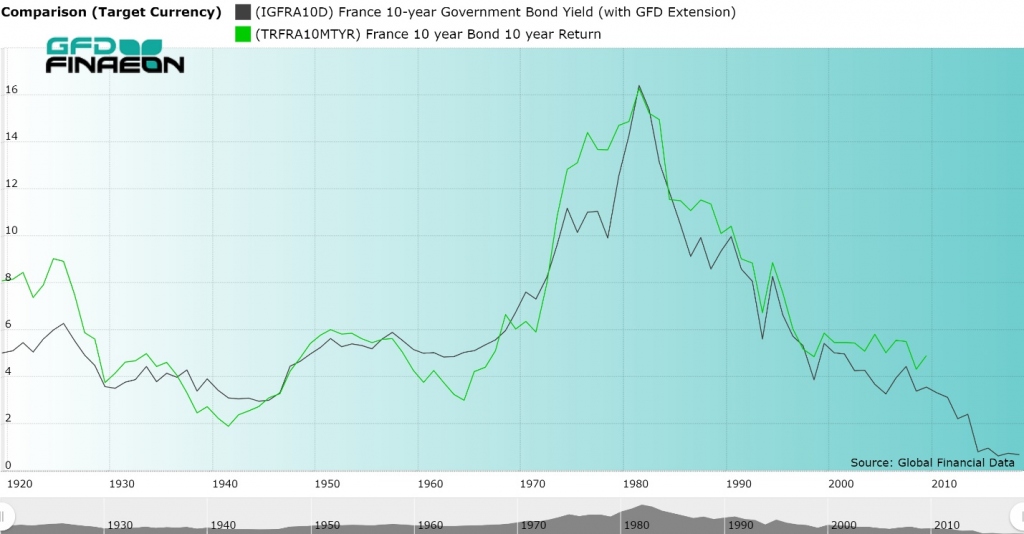
Figure 3. France 10-year Government Bond Yield and Return, 1919 to 2019
The Decade to Come
Examination of global bond yields in Figure 4 compares bond yields over the past 20 years in the United States, Germany, the United Kingdom, Japan, Canada, Australia and Switzerland. Interest rates in Germany, Japan and Switzerland have turned negative, and after adjusting for inflation, you would find that real yields in the remaining countries are negative.
If you look at the yield and return graphs for the United States, Japan and France in Figures 1, 2 and 3, you will see that the returns are not provided after 2009 because we don’t know what the behavior of bonds in the 2020s will be and thus cannot calculate the total return to bondholders between 2012 and 2022, for example, because this number will not be known until 2022.
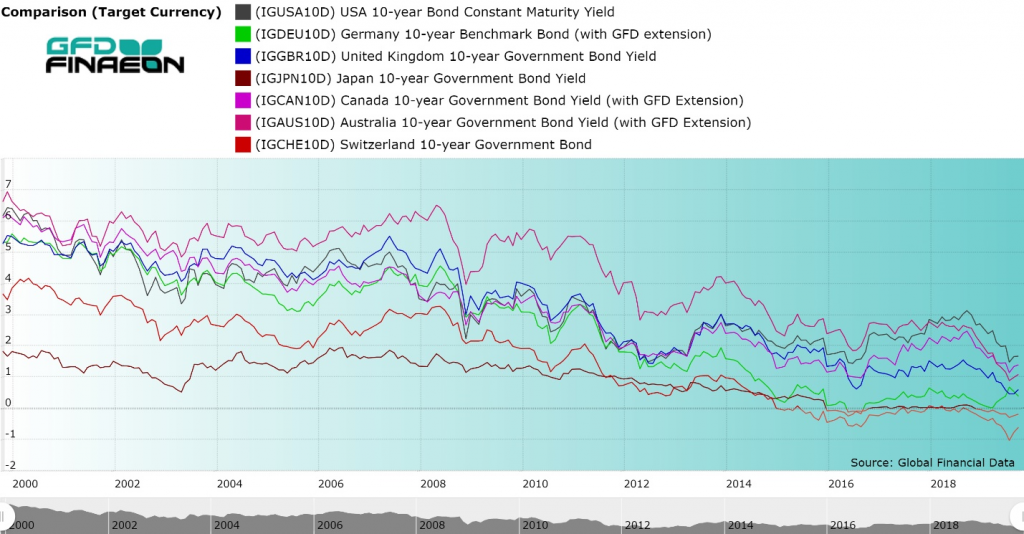
Figure 4. 10-Year Government Bond Yields for Seven Countries, 2000 to 2019
The inevitable logic that would come from this analysis so far is that if the yield on government bonds declined in the 2010s as they did in the 1980s, 1990s and 2000s, then a continued decline in government bond yields during the next decade is the most logical outcome. If bond yields were to rise, this would impose capital losses on bondholders, driving the total return to negative levels even below the yields that persisted in the 2010s.
To illustrate this fact, I have calculated what the total return to US government bondholders would be if bond yields rose by 0.125% in each of the next ten years and if they fell by 0.125% annually starting at a yield of 2% at the end of 2019. With these assumptions, I can calculate both the return from interest payments and the impact on the price of government bonds as the money was reinvested. I provide the results in Figure 5. In reality, bond yields will not rise or fall each year at a constant rate, but will fluctuate. The overall results will be the same regardless.
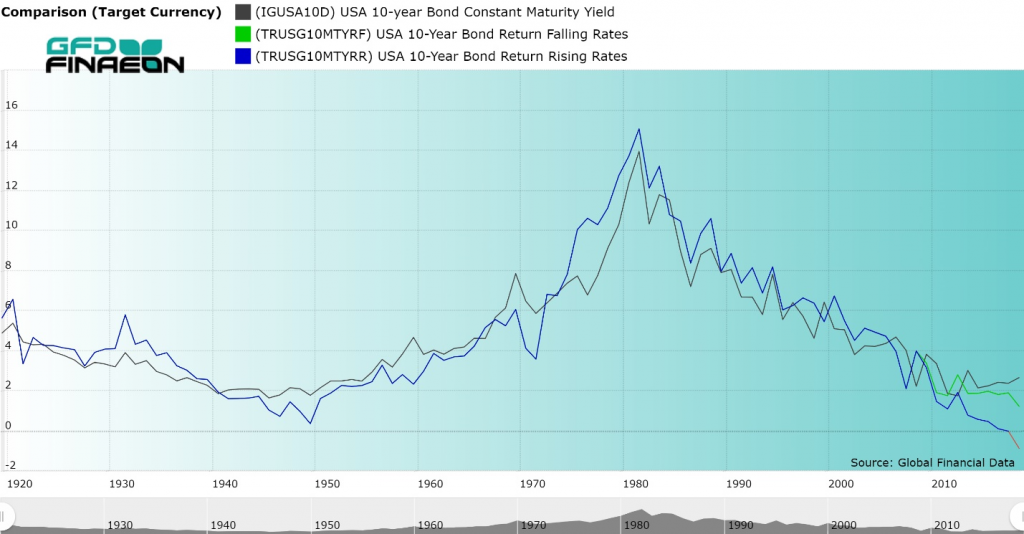
Figure 5. United States 10-year Government Bond Rising and Falling Yields and Returns
The black line in Figure 5 shows the path of government bond yields through 2019. The green line shows the returns that would occur if interest rates fell by 0.125% each year for the next 10 years, and the blue line shows what would happen if interest rates rose by 0.125% each year for the next 10 years. The cumulative effect of rising interest rates would be to generate negative returns to bondholders from 2019 by 2029. On the other hand, if government bond yields continue to fall, the decline in the total return is reduced by the capital gain shareholders would receive allowing returns to follow more closely to the bond yields that existed in the 2010s. Since the green line of falling interest rates adheres more closely to the actual behavior of interest rates between 2009 and 2019, it would seem more logical to predict falling interest rates over the course of the 2020s than rising interest rates.
Trouble in Bond Paradise
Whether you expect bond yields to rise or fall over the next 10 years, the conclusions reached in this paper should raise concerns for any fixed-income investor. If government bond yields rise over the next 10 years, by the end of the decade, if not earlier, fixed-income investors will receive a negative return on their investment. On the other hand, the only way for fixed-income investors to avoid negative returns is to hope for falling bond yields. Rising bond prices will offset the decline in yields, but at the same time may only delay the inevitable losses that fixed-income investors will eventually have to incur when interest rates rise at some point in the future.
What is true of the United States is true of the rest of the world. As Figure 4 indicates, 10-year government bond yields are lower than they are in the United States in virtually every developed country in the world. There is currently over $10 trillion in notes and bonds with a negative yield. If bond yields don’t rise, investors will receive a negative return because of rising bond prices. If bond yields do rise, investors will receive a negative return because of rising bond prices.
Some would say that a return to rising bond yields is inevitable, but this isn’t necessarily true. Bond yields fell throughout the 1800s. Yields fell from 5.345% in 1803 to 2.43% in 1897. There is no reason why bond yields might not fall for decades if the Federal Reserve can keep inflation under control. Population growth and economic growth may remain stagnant and constrain any increase in inflation or interest rates in the future. Data on these indicators are available through the GFDatabase and GFD Indices. All of the 10-year bond yields extend further back than is displayed in Figure 4. Fixed-income investors may be condemned to lose money during the next decade. The only question is how much?