 The Global Financial Database has more equity history for India than for any other country. The British East India Co. was founded on December 31, 1600, preceding the founding of the Dutch East India Co. by one year. Originally, shares were issued for specific ventures to India, but in 1657, joint stock shares were issued and these shares continued to trade in London until the company was dissolved in 1874 and the British government took over ownership of the company. The East India Co. paid a consistent 10.5% dividend from 1793 until the company’s dissolution in 1874. From the late seventeenth century until the early eighteenth century, 95% of Asian imports into Britain come from Mughal India and consisted mainly of cottons and spices produced in India. The decline of Mughal India in the first half of the eighteenth century led to the rise of the British East India Co. which took over India from the Mughal Empire after its victory in the Battle of Plessey in 1757. During the 1800s, the manufacture of textiles moved from India to Britain as the Industrial Revolution enabled Britain to produce the textiles it had formerly imported from India.
During the 1850s, British investment in India boomed, establishing railroads, canals, shipping companies and utilities that were essential not only for the development of the Indian economy, but to enforce Britain’s control over the colony. Merchants in Manchester and London supported building railroads that linked India’s main ports to the interior to bring cotton and other goods to the rest of the world. However, these railroads did not prove profitable, and the British government had to guarantee the 5% dividends the India railroads paid.
In the 1860s, investment in India spread to other sectors. Banks, tea companies, telegraph companies and gold mines were the most popular investments in India. The civil war in the United States led to an increase in demand for cotton causing a bubble in equity markets which burst when the American civil war ended. Although cotton and clothing represented a large portion of India’s production, most of these companies used local capital rather than British funds.
Traders dealt in securities in Calcutta in 1830, trading shares of the East India Co. Twenty-Two stockbrokers met under banyan trees in front of Bombay’s Town Hall in 1855 to trade shares. Premchand Roychand was a native Indian who became a stock broker in 1849 and was a founding member of The Native Share and Stock Brokers Association which later became the Bombay Stock Exchange.
Roychand had earned his fortune when the American Civil War drove the price of cotton up. This led to a speculative bubble in 1864 in which Back Bay Reclamation stock rose from 5,000 rupees to 50,000 rupees. Money made from cotton was redirected into the stock market, and new companies were floated to unsuspecting speculators. The number of companies traded in Bombay grew from 10 in 1855 to 62 in 1862 and over 100 by 1864. The market crashed in May 1865 when the American Civil War ended and Back Bay Reclamation stock fell from 50,000 Rupees to 2,000. Bank of Bombay stock fell from 2,850 rupees to 87. Hundreds of time bargains matured on July 1, 1865 and many speculators were wiped out.
The stock brokers moved to Dalal (Brokers’) Street in 1874. The Bombay Stock Exchange was founded on July 9, 1875 as the Native Share and Stock Brokers Association and was the first stock exchange established in Asia. The Calcutta Stock Exchange incorporated in 1908. Stock exchanges opened up throughout India in the twentieth century. Nineteen former stock exchanges have closed in India since 2000. Today, most trading in Indian stocks takes place on either the Bombay Stock Exchange or the National Stock Exchange, founded in 1992. Both have a market cap of over $2 trillion.
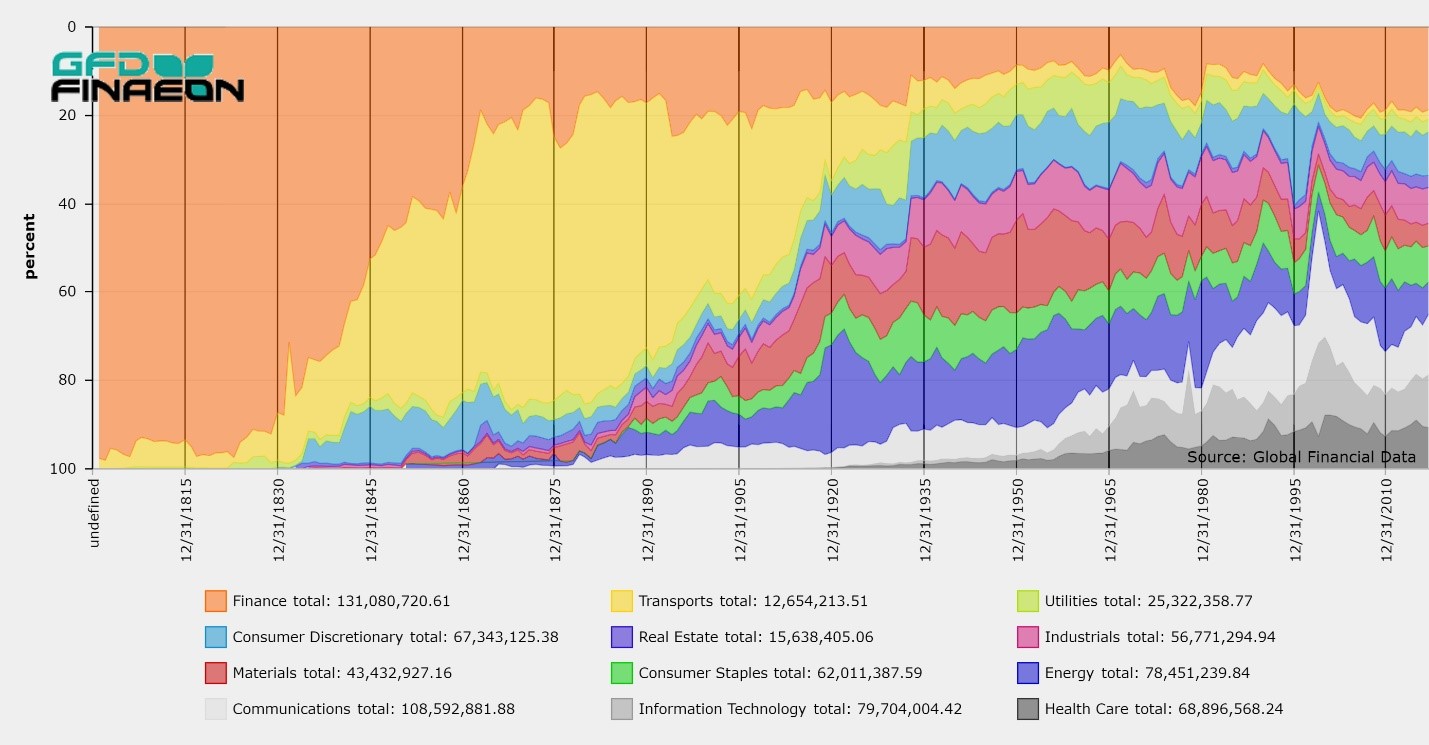
GFD’s index for India uses data on the East India Co. exclusively from 1692 until 1845. A second East India Co. existed between 1698 and 1708, but it merged with the old East India Co. in 1708 because the competition between the two was eliminating their profitability. Data for the East India Railway begins in 1846 and the number of Indian companies that listed in London grew to 20 in the 1860s and peaked at around 50 in 1900. Data for India companies listed in London is used from 1690 to 1922. The number of companies remained around 50 until 1922 when a stock index based upon shares that traded in India was introduced. The domestic India index used data from 100 companies from the Calcutta, Bombay and Madras stock exchanges. By linking together data from The East India Co. from 1690 to 1845, the London Stock Exchange from 1846 to 1922 and from Indian stock exchanges from 1922 to the present, we have been able to provide over three centuries of data on stock companies that operated in India.
Railroads represented a majority of the capitalization in London during the 1800s. You can divide the role of railroads in India into four eras. Up until 1869, British companies constructed and managed the trunk lines that were built with the government providing guarantees on the shares. In the 1870s, the Government of India joined the private companies and began to construct and manage the railways. There were ten private companies incorporated in Britain, which built and managed the trunk lines through India. In the early 1880s, the Government of India began forming public-private partnerships with the Government of India becoming the majority owner of most of the railways in India. In addition to this, after the Afghan War of 1878, the government saw the benefit of building railroads for military use, not just for transporting freight and passengers. The government began to nationalize the railroads in 1924. In 1951, forty-two railways were consolidated into a single Indian Railway completing the nationalization of the nation’s railways.
The first railway was built in India in 1832 and the first passenger railroad opened in 1853 between Bombay and Thane. During the 1800s, about 90 percent of the shares were British-owned and almost all of the capital was raised through equity, not through bonds. The railroad network grew rapidly between 1880 and 1900 and by the early 1900s, India had the fourth largest rail network in the world. By 1900, India had 39, 834 kilometers of railways open, 10,000 more than was open in the United Kingdom, while China had only 1,000 kilometers of railways.
Most railroads received guarantees from the British government so that if their dividends fell below a certain level, usually 5%, the railroad could borrow money from the government to meet the guaranteed return. Because most railways were unable to achieve the 5% rate of return and had to borrow from the government year after year, the government had the right to acquire the railroad after 25 years of subsidies. The government acquired a share of ownership beginning in the 1880s and in the 1920s, most of the railroads were nationalized. The trade-off was that stock in the railways, which represented a majority of the capitalization of the stock market, traded like bonds. Shareholders received a guaranteed return, but railways lacked the incentive to maximize their profits, limiting increases in the price of railway stocks.
By the 1870s, the stock market capitalization of India exceeded its GDP, but as railroads were slowly nationalized, the market cap/GDP ratio continually shrank. The British government did not attempt to develop the Indian economy in the same way that development occurred in the United States, Canada and Australia. The British desire to control the Indian economy and focus on industries that could develop natural resources that could provide exports to Britain and the rest of the world hindered its economic growth. If anything, India deindustrialized in the 1800s as growth in the textile industry in England replaced the demand for textiles from India. Investment went into cotton, tea, and gold mining, all natural resources, but there was little attempt to develop industry in India. British control over the economy bred an anti-colonialism among Gandhi and other supporters of independence that led to socialist policies once India became an independent country after World War II. It wasn’t until the 1980s that India began to promote private business and the stock market began to rise again.
The Global Financial Database has more equity history for India than for any other country. The British East India Co. was founded on December 31, 1600, preceding the founding of the Dutch East India Co. by one year. Originally, shares were issued for specific ventures to India, but in 1657, joint stock shares were issued and these shares continued to trade in London until the company was dissolved in 1874 and the British government took over ownership of the company. The East India Co. paid a consistent 10.5% dividend from 1793 until the company’s dissolution in 1874. From the late seventeenth century until the early eighteenth century, 95% of Asian imports into Britain come from Mughal India and consisted mainly of cottons and spices produced in India. The decline of Mughal India in the first half of the eighteenth century led to the rise of the British East India Co. which took over India from the Mughal Empire after its victory in the Battle of Plessey in 1757. During the 1800s, the manufacture of textiles moved from India to Britain as the Industrial Revolution enabled Britain to produce the textiles it had formerly imported from India.
During the 1850s, British investment in India boomed, establishing railroads, canals, shipping companies and utilities that were essential not only for the development of the Indian economy, but to enforce Britain’s control over the colony. Merchants in Manchester and London supported building railroads that linked India’s main ports to the interior to bring cotton and other goods to the rest of the world. However, these railroads did not prove profitable, and the British government had to guarantee the 5% dividends the India railroads paid.
In the 1860s, investment in India spread to other sectors. Banks, tea companies, telegraph companies and gold mines were the most popular investments in India. The civil war in the United States led to an increase in demand for cotton causing a bubble in equity markets which burst when the American civil war ended. Although cotton and clothing represented a large portion of India’s production, most of these companies used local capital rather than British funds.
Traders dealt in securities in Calcutta in 1830, trading shares of the East India Co. Twenty-Two stockbrokers met under banyan trees in front of Bombay’s Town Hall in 1855 to trade shares. Premchand Roychand was a native Indian who became a stock broker in 1849 and was a founding member of The Native Share and Stock Brokers Association which later became the Bombay Stock Exchange.
Roychand had earned his fortune when the American Civil War drove the price of cotton up. This led to a speculative bubble in 1864 in which Back Bay Reclamation stock rose from 5,000 rupees to 50,000 rupees. Money made from cotton was redirected into the stock market, and new companies were floated to unsuspecting speculators. The number of companies traded in Bombay grew from 10 in 1855 to 62 in 1862 and over 100 by 1864. The market crashed in May 1865 when the American Civil War ended and Back Bay Reclamation stock fell from 50,000 Rupees to 2,000. Bank of Bombay stock fell from 2,850 rupees to 87. Hundreds of time bargains matured on July 1, 1865 and many speculators were wiped out.
The stock brokers moved to Dalal (Brokers’) Street in 1874. The Bombay Stock Exchange was founded on July 9, 1875 as the Native Share and Stock Brokers Association and was the first stock exchange established in Asia. The Calcutta Stock Exchange incorporated in 1908. Stock exchanges opened up throughout India in the twentieth century. Nineteen former stock exchanges have closed in India since 2000. Today, most trading in Indian stocks takes place on either the Bombay Stock Exchange or the National Stock Exchange, founded in 1992. Both have a market cap of over $2 trillion.
GFD’s index for India uses data on the East India Co. exclusively from 1692 until 1845. A second East India Co. existed between 1698 and 1708, but it merged with the old East India Co. in 1708 because the competition between the two was eliminating their profitability. Data for the East India Railway begins in 1846 and the number of Indian companies that listed in London grew to 20 in the 1860s and peaked at around 50 in 1900. Data for India companies listed in London is used from 1690 to 1922. The number of companies remained around 50 until 1922 when a stock index based upon shares that traded in India was introduced. The domestic India index used data from 100 companies from the Calcutta, Bombay and Madras stock exchanges. By linking together data from The East India Co. from 1690 to 1845, the London Stock Exchange from 1846 to 1922 and from Indian stock exchanges from 1922 to the present, we have been able to provide over three centuries of data on stock companies that operated in India.
Railroads represented a majority of the capitalization in London during the 1800s. You can divide the role of railroads in India into four eras. Up until 1869, British companies constructed and managed the trunk lines that were built with the government providing guarantees on the shares. In the 1870s, the Government of India joined the private companies and began to construct and manage the railways. There were ten private companies incorporated in Britain, which built and managed the trunk lines through India. In the early 1880s, the Government of India began forming public-private partnerships with the Government of India becoming the majority owner of most of the railways in India. In addition to this, after the Afghan War of 1878, the government saw the benefit of building railroads for military use, not just for transporting freight and passengers. The government began to nationalize the railroads in 1924. In 1951, forty-two railways were consolidated into a single Indian Railway completing the nationalization of the nation’s railways.
The first railway was built in India in 1832 and the first passenger railroad opened in 1853 between Bombay and Thane. During the 1800s, about 90 percent of the shares were British-owned and almost all of the capital was raised through equity, not through bonds. The railroad network grew rapidly between 1880 and 1900 and by the early 1900s, India had the fourth largest rail network in the world. By 1900, India had 39, 834 kilometers of railways open, 10,000 more than was open in the United Kingdom, while China had only 1,000 kilometers of railways.
Most railroads received guarantees from the British government so that if their dividends fell below a certain level, usually 5%, the railroad could borrow money from the government to meet the guaranteed return. Because most railways were unable to achieve the 5% rate of return and had to borrow from the government year after year, the government had the right to acquire the railroad after 25 years of subsidies. The government acquired a share of ownership beginning in the 1880s and in the 1920s, most of the railroads were nationalized. The trade-off was that stock in the railways, which represented a majority of the capitalization of the stock market, traded like bonds. Shareholders received a guaranteed return, but railways lacked the incentive to maximize their profits, limiting increases in the price of railway stocks.
By the 1870s, the stock market capitalization of India exceeded its GDP, but as railroads were slowly nationalized, the market cap/GDP ratio continually shrank. The British government did not attempt to develop the Indian economy in the same way that development occurred in the United States, Canada and Australia. The British desire to control the Indian economy and focus on industries that could develop natural resources that could provide exports to Britain and the rest of the world hindered its economic growth. If anything, India deindustrialized in the 1800s as growth in the textile industry in England replaced the demand for textiles from India. Investment went into cotton, tea, and gold mining, all natural resources, but there was little attempt to develop industry in India. British control over the economy bred an anti-colonialism among Gandhi and other supporters of independence that led to socialist policies once India became an independent country after World War II. It wasn’t until the 1980s that India began to promote private business and the stock market began to rise again.
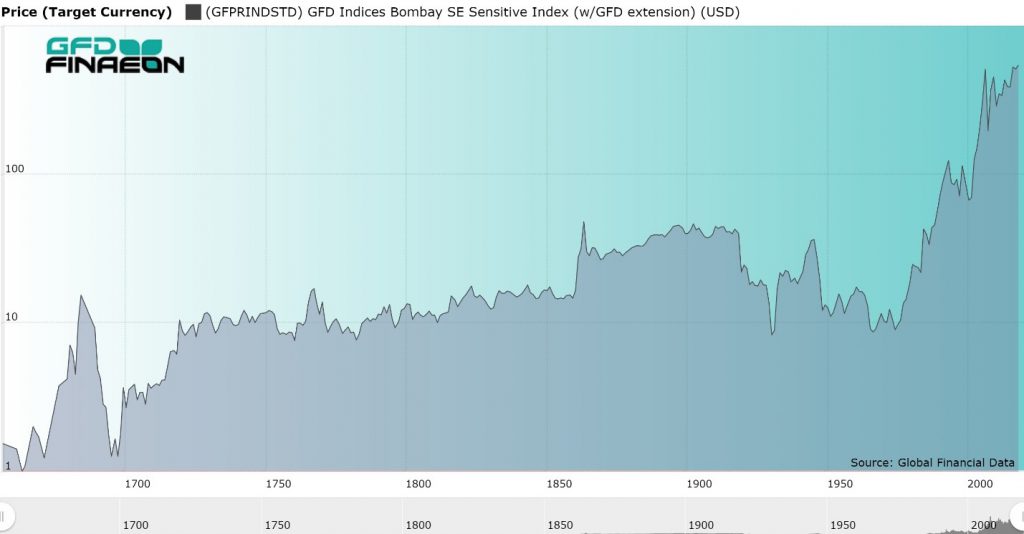
Figure 1. GFD India Price Index, 1657 to 2019
The performance of stocks in India over the past 350 years is illustrated in Figure 1. The most interesting observation here is the lack of movement in the index from the 1700s to 1980. All of the return to shareholders came in the form of dividends. This is the legacy of the guaranteed returns that first went to shareholders of East India Co. stock between 1792 and 1874, and to the railroads up until the 1890s. After the government gained control over the railways in the 1880s, investment went into tea, rubber, cotton, mining and other resources, not into industries that could develop the country. The ratio of the stock market’s capitalization to GDP shrank between 1880 and 1980 and investors had to rely upon dividends to obtain a return. Figure 2 shows the behavior of Indian stocks since the domestic index was first computed in 1920. As can be seen, there was virtually no change in the price of Indian stocks from 1920 until 1980. The Indian economy went through an economic boom between 1910 and 1930 and an economic bust between 1930 and 1950. After India became an independent country, the economy went through a period of economic boom driven by Five-Year plans and socialist policies leading to average growth in the economy of 3.1 percent per year. However, growth slowed between 1970 and 1990 leading to a period of economic liberalization which has prevailed in India since P.V. Narasimha Rao and Manmohan Singh introduced these reforms in 1991. This has given investors the opportunity to finally benefit from growth in the Indian economy. Today, there is investment in information technology as India tries to provide growth to over 1.3 billion people.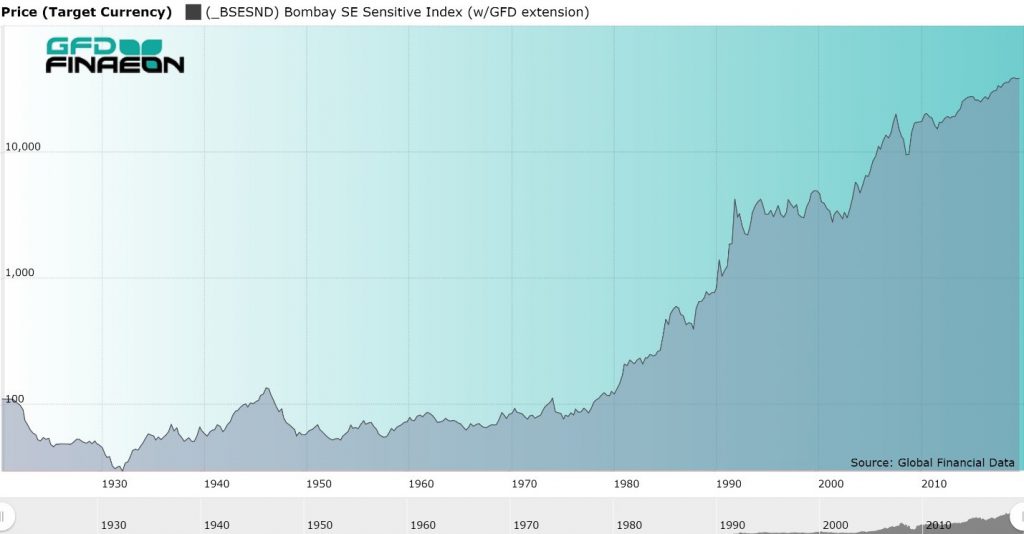
Figure 2. Domestic India Stock Price Index, 1920 to 2018
On the other hand, since India was a British colony, there was little risk of default on its outstanding bonds. Figure 3 provides a graph of the yield on Indian government bonds from 1722 until 2019. The series uses the yield on East India Co. stock from 1722 until 1864 when the Government of India issued its first bonds. The dividend was set at 10.5% in 1793 and remained at that level until the dissolution of the company in 1874. India issued a 4% bond in 1864 which was later replaced by bonds yielding 3.5% then 3%. Unlike many other emerging markets, India has never defaulted on its bonds, a fact that is reflected in the yield remaining around 4% until India’s independence. The yield rose to 14% in 1995 because of inflation, but has declined since then.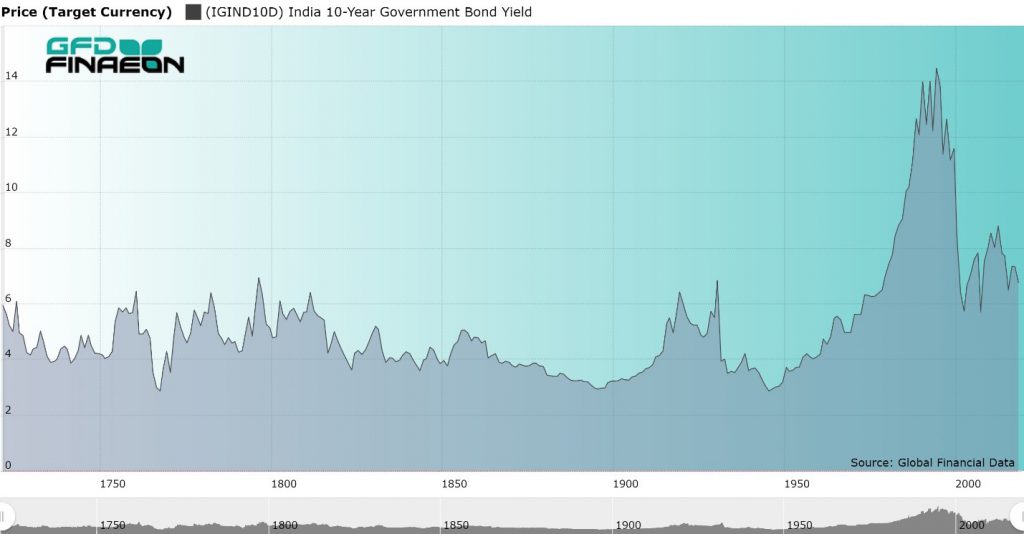
Figure 3. Yield on East India Co. Stock and India Government Bonds, 1722 to 2019
The actual numbers that measure the return to stocks and bonds in India is provided in Table 1. As can be seen, there was virtually no change in the price of Indian stocks between 1720 and 1980. The combination of a fixed dividend on East India Co. stock, guaranteed returns on Indian railroads, the deindustrialization of India and the focus on small, resource-based industries limited the opportunity for capital gains in India. Investors relied upon dividends as their source of income. During the past 200 years, Indian stocks have only provided a 4.16% annual return, barely 1% greater than bonds.| Period | Name | Stock Price | Stock Return | Bond Return | Premium |
| 1692-1720 | Glorious Revolution | 3.3 | 11.39 | ||
| 1720-1792 | Mercantilism | 0.11 | 5.1 | ||
| 1792-1848 | Transportation | 0.46 | 5.48 | ||
| 1848-1914 | Free Trade | 1.69 | 6.39 | 3.14 | 3.25 |
| 1914-1945 | World Wars | -0.68 | 4.79 | 5.4 | -0.61 |
| 1945-1981 | Keynesianism | -1.03 | 7.1 | 1 | 6.1 |
| 1981-2018 | Globalization | 8.79 | 12.45 | 2.92 | 9.53 |
| 1692-2018 | All History | 1.02 | 6.92 | ||
| 1822-2018 | Bond History | 0.38 | 4.16 | 3.14 | 1.02 |
Table 1, Returns to Stocks and Bonds in USD in India, 1692 to 2018